
Page 118 - Special Topic Session (STS) - Volume 1
P. 118
STS410 Abdul Ghapor H. et al.
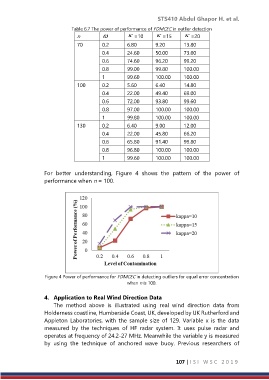
Table 6.7 The power of performance of FDMCEC in outlier detection
n =10 =15 =20
70 0.2 6.80 9.20 13.80
0.4 24.60 50.00 73.60
0.6 74.60 96.20 99.20
0.8 99.00 99.80 100.00
1 99.60 100.00 100.00
100 0.2 5.60 6.40 14.80
0.4 22.00 49.40 69.00
0.6 72.00 93.80 99.60
0.8 97.00 100.00 100.00
1 99.80 100.00 100.00
130 0.2 6.40 9.00 12.00
0.4 22.00 45.80 66.20
0.6 65.80 91.40 99.80
0.8 96.80 100.00 100.00
1 99.60 100.00 100.00
For better understanding, Figure 4 shows the pattern of the power of
performance when n = 100.
Figure 4 Power of performance for FDMCEC in detecting outliers for equal error concentration
when n is 100.
4. Application to Real Wind Direction Data
The method above is illustrated using real wind direction data from
Holderness coastline, Humberside Coast, UK, developed by UK Rutherford and
Appleton Laboratories, with the sample size of 129. Variable x is the data
measured by the techniques of HF radar system. It uses pulse radar and
operates at frequency of 24.2-27 MHz. Meanwhile the variable y is measured
by using the technique of anchored wave buoy. Previous researchers of
107 | I S I W S C 2 0 1 9