
Page 135 - Special Topic Session (STS) - Volume 1
P. 135
STS419 Zuraeda Ibrahim et al.
2
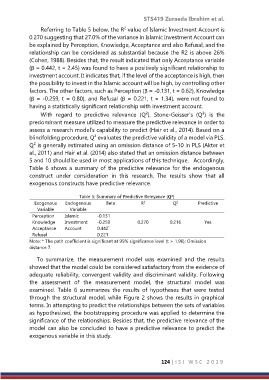
Referring to Table 5 below, the R value of Islamic Investment Account is
0.270 suggesting that 27.0% of the variance in Islamic Investment Account can
be explained by Perception, Knowledge, Acceptance and also Refusal, and the
relationship can be considered as substantial because the R2 is above 26%
(Cohen, 1988). Besides that, the result indicated that only Acceptance variable
(β = 0.442, t = 2.45) was found to have a positively significant relationship to
investment account. It indicates that, if the level of the acceptance is high, then
the possibility to invest in the Islamic account will be high, by controlling other
factors. The other factors, such as Perception (β = -0.131, t = 0.62), Knowledge
(β = -0.259, t = 0.80), and Refusal (β = 0.221, t = 1.34), were not found to
having a statistically significant relationship with investment account.
With regard to predictive relevance (Q²), Stone-Geisser’s (Q²) is the
predominant measure utilized to measure the predictive relevance in order to
assess a research model’s capability to predict (Hair et al., 2014). Based on a
blindfolding procedure, Q² evaluates the predictive validity of a model via PLS.
Q² is generally estimated using an omission distance of 5-10 in PLS (Akter et
al., 2011) and Hair et al. (2014) also stated that an omission distance between
5 and 10 should be used in most applications of this technique. Accordingly,
Table 6 shows a summary of the predictive relevance for the endogenous
construct under consideration in this research. The results show that all
exogenous constructs have predictive relevance.
Table 5: Summary of Predictive Relevance ( )
Exogenous Endogenous Beta R 2 Q 2 Predictive
Variable Variable
Perception Islamic -0.131
Knowledge Investment -0.259 0.270 0.216 Yes
Acceptance Account 0.442 *
Refusal 0.221
Note: * The path coefficient is significant at 95% significance level (t > 1.96); Omission
distance 7.
To summarize, the measurement model was examined and the results
showed that the model could be considered satisfactory from the evidence of
adequate reliability, convergent validity and discriminant validity. Following
the assessment of the measurement model, the structural model was
examined. Table 6 summarizes the results of hypotheses that were tested
through the structural model, while Figure 2 shows the results in graphical
terms. In attempting to predict the relationships between the sets of variables
as hypothesized, the bootstrapping procedure was applied to determine the
significance of the relationships. Besides that, the predictive relevance of the
model can also be concluded to have a predictive relevance to predict the
exogenous variable in this study.
124 | I S I W S C 2 0 1 9