
Page 134 - Special Topic Session (STS) - Volume 1
P. 134
STS419 Zuraeda Ibrahim et al.
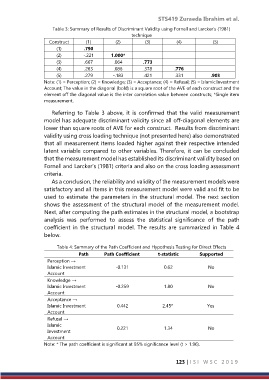
Table 3: Summary of Results of Discriminant Validity using Fornell and Larcker’s (1981)
technique
Construct (1) (2) (3) (4) (5)
(1) .790
(2) -.221 1.000*
(3) .667 .064 .773
(4) .263 .086 .378 .776
(5) .279 -.183 .421 .331 .903
Note: (1) = Perception; (2) = Knowledge; (3) = Acceptance; (4) = Refusal; (5) = Islamic Investment
Account; The value in the diagonal (bold) is a square root of the AVE of each construct and the
element off the diagonal value is the inter correlation value between constructs; *Single item
measurement.
Referring to Table 3 above, it is confirmed that the valid measurement
model has adequate discriminant validity since all off-diagonal elements are
lower than square roots of AVE for each construct. Results from discriminant
validity using cross loading technique (not presented here) also demonstrated
that all measurement items loaded higher against their respective intended
latent variable compared to other variables. Therefore, it can be concluded
that the measurement model has established its discriminant validity based on
Fornell and Larcker’s (1981) criteria and also on the cross loading assessment
criteria.
As a conclusion, the reliability and validity of the measurement models were
satisfactory and all items in this measurement model were valid and fit to be
used to estimate the parameters in the structural model. The next section
shows the assessment of the structural model of the measurement model.
Next, after computing the path estimates in the structural model, a bootstrap
analysis was performed to assess the statistical significance of the path
coefficient in the structural model. The results are summarized in Table 4
below.
Table 4: Summary of the Path Coefficient and Hypothesis Testing for Direct Effects
Path Path Coefficient t-statistic Supported
Perception →
Islamic Investment -0.131 0.62 No
Account
Knowledge →
Islamic Investment -0.259 1.80 No
Account
Acceptance →
Islamic Investment 0.442 2.45* Yes
Account
Refusal →
Islamic 0.221 1.34 No
Investment
Account
Note: * The path coefficient is significant at 95% significance level (t > 1.96).
123 | I S I W S C 2 0 1 9