
Page 133 - Special Topic Session (STS) - Volume 1
P. 133
STS419 Zuraeda Ibrahim et al.
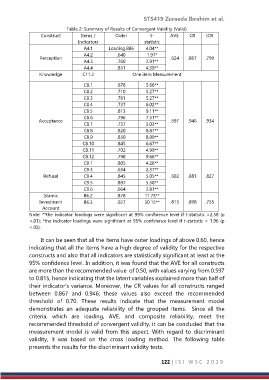
Table 2: Summary of Results of Convergent Validity (Valid)
Construct Items / Outer t- AVE CR ICR
Indicators statistic
A4.1 Loading.886 4.04**
A4.2 .640 1.97*
Perception .624 .867 .799
A4.3 .760 2.91**
A4.4 .851 4.39**
Knowledge C11.2 One item Measurement
C8.1 .678 5.66**
C8.2 .710 5.27**
C8.3 .761 5.27**
C8.4 .737 6.02**
C8.5 .813 9.11**
C8.6 .796 7.51**
Acceptance .597 .946 .934
C8.7 .737 5.03**
C8.8 .820 8.87**
C8.9 .850 8.99**
C8.10 .845 6.67**
C8.11 .702 4.99**
C8.12 .798 9.66**
C9.1 .805 4.26**
C9.3 .634 2.37**
Refusal C9.4 .845 5.05** .602 .881 .827
C9.5 .897 5.50**
C9.6 .664 2.81**
Islamic B6.2 .878 11.73**
Investment B6.3 .927 30.15** .815 .898 .755
Account
Note: **the indicator loadings were significant at 99% confidence level if t-statistic >2.58 (p
<.01); *the indicator loadings were significant at 95% confidence level if t-statistic > 1.96 (p
<.05).
It can be seen that all the items have outer loadings of above 0.60, hence
indicating that all the items have a high degree of validity for the respective
constructs and also that all indicators are statistically significant at least at the
95% confidence level. In addition, it was found that the AVE for all constructs
are more than the recommended value of 0.50, with values varying from 0.597
to 0.815, hence indicating that the latent variables explained more than half of
their indicator’s variance. Moreover, the CR values for all constructs ranged
between 0.867 and 0.946; these values also exceed the recommended
threshold of 0.70. These results indicate that the measurement model
demonstrates an adequate reliability of the grouped items. Since all the
criteria, which are loading, AVE, and composite reliability, meet the
recommended threshold of convergent validity, it can be concluded that the
measurement model is valid from this aspect. With regard to discriminant
validity, it was based on the cross loading method. The following table
presents the results for the discriminant validity tests.
122 | I S I W S C 2 0 1 9