Page 132 - Special Topic Session (STS) - Volume 1
P. 132

STS419 Zuraeda Ibrahim et al.
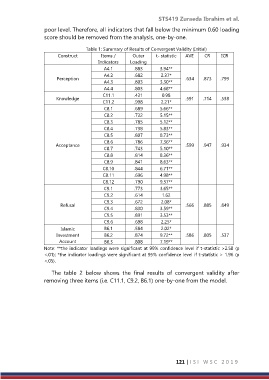
                  poor level. Therefore, all indicators that fall below the minimum 0.60 loading
                  score should be removed from the analysis, one-by-one.

                                  Table 1: Summary of Results of Convergent Validity (Initial)
                       Construct        Items /     Outer    t- statistic    AVE    CR    ICR
                                       Indicators    Loading
                                         A4.1        .883     3.94**
                                         A4.2        .682      2.37*
                       Perception                                       .634    .873    .799
                                         A4.3        .803     3.30**
                                         A4.4        .803     4.68**
                                        C11.1        .431      0.98
                       Knowledge                                        .591    .714    .538
                                        C11.2        .998      2.21*
                                         C8.1        .689     5.66**
                                         C8.2        .732     5.15**
                                         C8.3        .785     5.12**
                                         C8.4        .738     5.83**
                                         C8.5        .807     8.73**
                                         C8.6        .786     7.36**
                      Acceptance                                        .599    .947    .934
                                         C8.7        .743     5.10**
                                         C8.8        .814     8.36**
                                         C8.9        .841     8.63**
                                        C8.10        .844     6.71**
                                        C8.11        .696     4.98**
                                        C8.12        .790     9.37**
                                         C9.1        .773     3.65**
                                         C9.2        .614      1.62
                                         C9.3        .672      2.08*
                        Refusal                                         .566    .885    .849
                                         C9.4        .830     3.59**
                                         C9.5        .891     3.53**
                                         C9.6        .698      2.25*
                        Islamic          B6.1        .584      2.02*
                       Investment        B6.2        .874     9.72**    .586    .805    .537
                        Account          B6.3        .808     7.19**
                  Note: **the indicator loadings were significant at 99% confidence level if t-statistic >2.58 (p
                  <.01); *the indicator loadings were significant at 95% confidence level if t-statistic > 1.96 (p
                  <.05).

                     The  table  2  below  shows  the  final  results  of  convergent  validity  after
                  removing three items (i.e. C11.1, C9.2, B6.1) one-by-one from the model.


                                                                     121 | I S I   W S C   2 0 1 9
   127   128   129   130   131   132   133   134   135   136   137