
Page 238 - Special Topic Session (STS) - Volume 1
P. 238
STS426 Tanuka C.
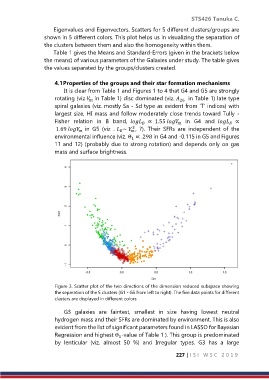
Eigenvalues and Eigenvectors. Scatters for 5 different clusters/groups are
shown in 5 different colors. This plot helps us in visualizing the separation of
the clusters between them and also the homogeneity within them.
Table 1 gives the Means and Standard-Errors (given in the brackets below
the means) of various parameters of the Galaxies under study. The table gives
the values separated by the groups/clusters created.
4.1 Properties of the groups and their star formation mechanisms
It is clear from Table 1 and Figures 1 to 4 that G4 and G5 are strongly
rotating (viz in Table 1) disc dominated (viz. in Table 1) late type
26
spiral galaxies (viz. mostly Sa - Sd type as evident from ‘T’ indices) with
largest size, HI mass and follow moderately close trends toward Tully -
Fisher relation in B band, ∝ 1.55 in G4 and ∝
3
1.69 in G5 (viz . ~ , ?). Their SFRs are independent of the
environmental influence (viz. Θ ∝ .298 in G4 and -0.115 in G5 and Figures
1
11 and 12) (probably due to strong rotation) and depends only on gas
mass and surface brightness.
Figure 3. Scatter plot of the two directions of the dimension reduced subspace showing
the separation of the 5 clusters (G1 - G5 from left to right). The five data points for different
clusters are displayed in different colors
G3 galaxies are faintest, smallest in size having lowest neutral
hydrogen mass and their SFRs are dominated by environment. This is also
evident from the list of significant parameters found in LASSO for Bayesian
Regression and highest Θ -value of Table 1 ). This group is predominated
1
by lenticular (viz. almost 50 %) and Irregular types. G3 has a large
227 | I S I W S C 2 0 1 9