
Page 239 - Special Topic Session (STS) - Volume 1
P. 239
STS426 Tanuka C.
percentage of bulge dominated galaxies (viz T ∼ −3/−1 for 51 objects).
Though the SFR of G4 is highest and that for G3 is smallest, SFEs (viz
/MHI) are comparable for G4 and G3 (viz. ∼ 13.08 and 14.06. Table 1).
The reason might be due to rapid consumption of neutral gas for dwarf
galaxies than for larger disc galaxies (?).
G2 and G1 have moderate rotations and they do not follow Tully-
Fisher relation (viz. for G2, ∝ 0.814 , for G1, ∝
0.705 ). This might be due to the fact that turbulent gas motions for
galaxies in these groups play significant role in mass distribution. G2
contains most of the BCDs (viz 50) than G3 (viz 25). In G1, SFR is weekly
controlled by environment (viz. Table 1 and Figures ?? and ??). In G2 and
G3, SFE are very low. It might be due to the fact that though in G1 SFR is
moderate, due to moderate influence of the environment (Θ ∼ 0.498) and
5
a higher value of gas depletion time (∼ 15.30 Gyr, Table 1) the gas is
depleted in longer time and due to low availability of HI mass (viz. Table
1) SFE becomes low. On the other hand in G2, massive stars form in a
shorter time (mean of G2 is greater than mean of G1, viz. Table
1) which depletes neutral gas (not in enough amount compared to G4 and
G5) by galactic wind decreasing the SFE to a minimum value.
Also the SBB profiles are different in the groups indicating different
star formation histories of the galaxies in the groups. It is clear from the
values from Table 1 that G4 and G5 have maximum surface brightness
26
followed by G2 and G1 and finally G5 group of galaxies have minimum
ones. This indicates that G4 and G5 are largest in size and G3 is the
smallest group of early type bulge dominated lenticular galaxies. The
same scenario has been reflected from their several SFR distributions . The
SFRs are maximum in groups G4, G5 and G2 and lowest in G3.
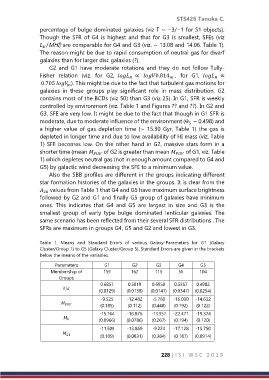
Table 1. Means and Standard Errors of various Galaxy-Parameters for G1 (Galaxy
Cluster/Group 1) to G5 (Galaxy Cluster/Group 5). Standard Errors are given in the brackets
below the means of the variables.
Parameters G1 G2 G3 G4 G5
Membership of 159 162 115 56 104
Groups
0.6857 0.5819 0.6959 0.5357 0.4902
/ (0.0129) (0.0138) (0.0147) (0.0347) (0.0254)
-9.525 -12.482 -5.760 -16.030 -14.632
(0.185) (0.112) (0.448) (0.192) (0.122)
-15.164 -16.876 -13.957 -22.471 -19.374
(0.0966) (0.0786) (0.267) (0.194) (0.120)
-11.509 -13.869 -9.224 -17.128 -15.750
21
(0.109) (0.0831) (0.384) (0.187) (0.0914)
228 | I S I W S C 2 0 1 9