
Page 237 - Special Topic Session (STS) - Volume 1
P. 237
STS426 Tanuka C.
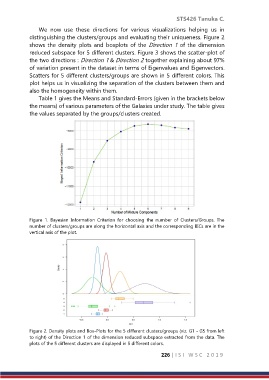
We now use these directions for various visualizations helping us in
distinguishing the clusters/groups and evaluating their uniqueness. Figure 2
shows the density plots and boxplots of the Direction 1 of the dimension
reduced subspace for 5 different clusters. Figure 3 shows the scatter-plot of
the two directions : Direction 1 & Direction 2 together explaining about 97%
of variation present in the dataset in terms of Eigenvalues and Eigenvectors.
Scatters for 5 different clusters/groups are shown in 5 different colors. This
plot helps us in visualizing the separation of the clusters between them and
also the homogeneity within them.
Table 1 gives the Means and Standard-Errors (given in the brackets below
the means) of various parameters of the Galaxies under study. The table gives
the values separated by the groups/clusters created.
Figure 1. Bayesian Information Criterion for choosing the number of Clusters/Groups. The
number of clusters/groups are along the horizontal axis and the corresponding BICs are in the
vertical axis of the plot.
Figure 2. Density plots and Box-Plots for the 5 different clusters/groups (viz. G1 - G5 from left
to right) of the Direction 1 of the dimension reduced subspace extracted from the data. The
plots of the 5 different clusters are displayed in 5 different colors.
226 | I S I W S C 2 0 1 9