
Page 259 - Special Topic Session (STS) - Volume 1
P. 259
STS426 Guillaume B.
correlations within each IFS most noticeable at lower frequencies. For
independent frequencies, the integral of the sine and cosine components is
always zero. For all other
2
2
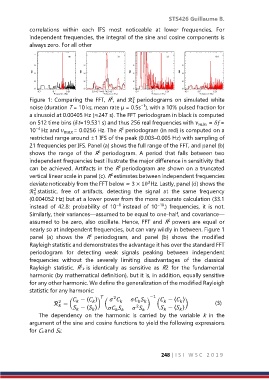
Figure 1: Comparing the FFT, R , and ℛ periodograms on simulated white
1
−1
noise (duration T = 10 ks, mean rate µ = 0.5s ), with a 10% pulsed fraction for
a sinusoid at 0.00405 Hz (≈247 s). The FFT periodogram in black is computed
on 512 time bins (t=19.531 s) and thus 256 real frequencies with = =
−4
2
10 Hz and = 0.0256 Hz. The R periodogram (in red) is computed on a
restricted range around ±1 IFS of the peak (0.003–0.005 Hz) with sampling of
21 frequencies per IFS. Panel (a) shows the full range of the FFT, and panel (b)
shows the range of the R periodogram. A period that falls between two
2
independent frequencies best illustrate the major difference in sensitivity that
2
can be achieved. Artifacts in the R periodogram are shown on a truncated
2
vertical linear scale in panel (c). R estimates between independent frequencies
deviate noticeably from the FFT below ≈ 3 × 10 Hz. Lastly, panel (d) shows the
3
2
ℛ statistic, free of artifacts, detecting the signal at the same frequency
1
(0.004052 Hz) but at a lower power from the more accurate calculation (33.1
instead of 42.8: probability of 10 −8 instead of 10 −10 .) frequencies, it is not.
Similarly, their variances—assumed to be equal to one-half, and covariance—
assumed to be zero, also oscillate. Hence, FFT and R powers are equal or
2
nearly so at independent frequencies, but can vary wildly in between. Figure 1
2
panel (a) shows the R periodogram, and panel (b) shows the modified
Rayleigh statistic and demonstrates the advantage it has over the standard FFT
periodogram for detecting weak signals peaking between independent
frequencies without the severely limiting disadvantages of the classical
Rayleigh statistic. R k is identically as sensitive as R2 for the fundamental
2
harmonic (by mathematical definition), but it is, in addition, equally sensitive
for any other harmonic. We define the generalization of the modified Rayleigh
statistic for any harmonic:
2
− 〈 〉 −1 − 〈 〉
2
ℛ = ( − 〈 〉 ) ( ) ( − 〈 〉 ) (3)
2
The dependency on the harmonic is carried by the variable k in the
argument of the sine and cosine functions to yield the following expressions
for Ck and Sk:
248 | I S I W S C 2 0 1 9