
Page 262 - Special Topic Session (STS) - Volume 1
P. 262
STS426 Guillaume B.
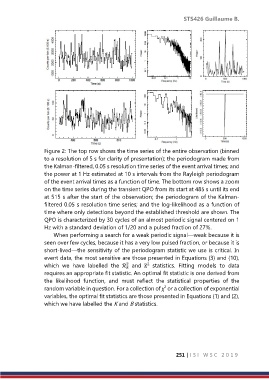
Figure 2: The top row shows the time series of the entire observation (binned
to a resolution of 5 s for clarity of presentation); the periodogram made from
the Kalman-filtered, 0.05 s resolution time series of the event arrival times; and
the power at 1 Hz estimated at 10 s intervals from the Rayleigh periodogram
of the event arrival times as a function of time. The bottom row shows a zoom
on the time series during the transient QPO from its start at 485 s until its end
at 515 s after the start of the observation; the periodogram of the Kalman-
filtered 0.05 s resolution time series; and the log-likelihood as a function of
time where only detections beyond the established threshold are shown. The
QPO is characterized by 30 cycles of an almost periodic signal centered on 1
Hz with a standard deviation of 1/20 and a pulsed fraction of 27%.
When performing a search for a weak periodic signal—weak because it is
seen over few cycles, because it has a very low pulsed fraction, or because it is
short-lived—the sensitivity of the periodogram statistic we use is critical. In
event data, the most sensitive are those presented in Equations (3) and (10),
2
2
which we have labelled the ℛ and Ƶ statistics. Fitting models to data
requires an appropriate fit statistic. An optimal fit statistic is one derived from
the likelihood function, and must reflect the statistical properties of the
2
random variable in question. For a collection of χ or a collection of exponential
variables, the optimal fit statistics are those presented in Equations (1) and (2),
which we have labelled the K and B statistics.
251 | I S I W S C 2 0 1 9