
Page 261 - Special Topic Session (STS) - Volume 1
P. 261
STS426 Guillaume B.
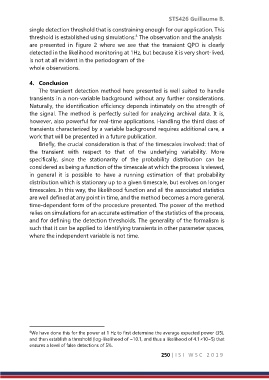
single detection threshold that is constraining enough for our application. This
4
threshold is established using simulations. The observation and the analysis
are presented in Figure 2 where we see that the transient QPO is clearly
detected in the likelihood monitoring at 1Hz, but because it is very short-lived,
is not at all evident in the periodogram of the
whole observations.
4. Conclusion
The transient detection method here presented is well suited to handle
transients in a non-variable background without any further considerations.
Naturally, the identification efficiency depends intimately on the strength of
the signal. The method is perfectly suited for analyzing archival data. It is,
however, also powerful for real-time applications. Handling the third class of
transients characterized by a variable background requires additional care, a
work that will be presented in a future publication.
Briefly, the crucial consideration is that of the timescales involved: that of
the transient with respect to that of the underlying variability. More
specifically, since the stationarity of the probability distribution can be
considered as being a function of the timescale at which the process is viewed,
in general it is possible to have a running estimation of that probability
distribution which is stationary up to a given timescale, but evolves on longer
timescales. In this way, the likelihood function and all the associated statistics
are well defined at any point in time, and the method becomes a more general,
time-dependent form of the procedure presented. The power of the method
relies on simulations for an accurate estimation of the statistics of the process,
and for defining the detection thresholds. The generality of the formalism is
such that it can be applied to identifying transients in other parameter spaces,
where the independent variable is not time.
4 We have done this for the power at 1 Hz to first determine the average expected power (35),
and then establish a threshold (log-likelihood of −10.1, and thus a likelihood of 4.1×10⁻⁵) that
ensures a level of false detections of 5%.
250 | I S I W S C 2 0 1 9