Page 30 - Special Topic Session (STS) - Volume 1
P. 30

STS346 A.H.M. Rahmatullah Imon
                  at  the  upper  or  lower  corner  of  the  plot  depending  on  their  signs;  large
                  positive outliers will be plotted at the upper corner and large negative outliers
                  will be located at the bottom corner of the plot.

                  3.  Results
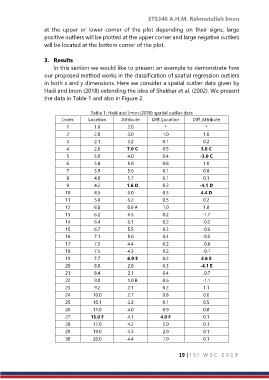
                      In this section we would like to present an example to demonstrate how
                  our proposed method works in the classification of spatial regression outliers
                  in both x and y dimensions. Here we consider a spatial outlier data given by
                  Hadi and Imon (2018) extending the idea of Shekhar et al. (2002). We present
                  the data in Table 1 and also in Figure 2.

                                    Table 1: Hadi and Imon (2018) spatial outlier data
                         Index     Location     Attribute    Diff_Location    Diff_Attribute
                           1         1.0          2.0           *               *
                           2         2.0          3.0          1.0             1.0
                           3         2.1          3.2          0.1             0.2
                           4         2.6           7.0 C       0.5            3.8 C
                           5         3.0          4.0          0.4            -3.0 C
                           6         3.8          5.0          0.8             1.0
                           7         3.9          5.6          0.1             0.6
                           8         4.0          5.7          0.1             0.1
                           9         4.2           1.6 D       0.2            -4.1 D
                          10         4.5          6.0          0.3            4.4 D
                          11         5.0          6.2          0.5             0.2
                          12         6.0           8.0 A       1.0             1.8
                          13         6.2          6.3          0.2             -1.7
                          14         6.4          6.1          0.2             -0.2
                          15         6.7          5.5          0.3             -0.6
                          16         7.1          5.0          0.4             -0.5
                          17         7.3          4.4          0.2             -0.6
                          18         7.5          4.3          0.2             -0.1
                          19         7.7           6.9 E       0.2            2.6 E
                          20         8.0          2.8          0.3            -4.1 E
                          21         8.4          2.1          0.4             -0.7
                          22         9.0           1.0 B       0.6             -1.1
                          23         9.2          2.1          0.2             1.1
                          24         10.0         2.7          0.8             0.6
                          25         10.1         3.2          0.1             0.5
                          26         11.0         4.0          0.9             0.8
                          27        15.0 F        4.1          4.0 F           0.1
                          28         17.0         4.2          2.0             0.1
                          29         19.0         4.3          2.0             0.1
                          30         20.0         4.4          1.0             0.1


                                                                      19 | I S I   W S C   2 0 1 9
   25   26   27   28   29   30   31   32   33   34   35