
Page 32 - Special Topic Session (STS) - Volume 1
P. 32
STS346 A.H.M. Rahmatullah Imon
Index Del St. Residual Leverage GSR GP
13 -0.92108 0.045639 2.34566 0.05185
14 -0.10826 0.045639 -2.56908 0.05185
15 -0.33030 0.041275 -0.32208 0.04367
16 -0.28573 0.037989 -0.85865 0.03835
17 -0.32172 0.045639 -0.74085 0.05185
18 -0.05503 0.045639 -0.84428 0.05185
19 1.43538 0.045639 3.58453 E 0.05185
20 -2.42202 0.041275 -6.02091 E 0.04367
21 -0.39244 0.037989 -1.00843 0.03835
22 -0.62533 0.034647 -1.61273 0.03631
23 0.58737 0.045639 1.39415 0.05185
24 0.26077 0.035612 0.59882 0.04571
25 0.27470 0.051079 0.59176 0.06290
26 0.35834 0.037710 0.84471 0.05471
27 -0.49040 0.636897 F -0.91806 1.75404 F
28 -0.12121 0.131865 -0.24012 0.34271 G
29 -0.12121 0.131865 -0.24012 0.34271 H
30 -0.02276 0.040885 -0.06854 0.06658
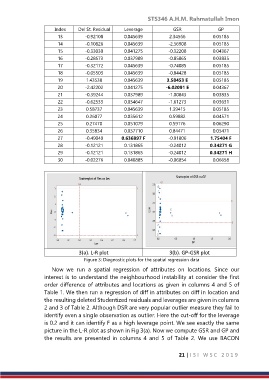
3(a). L-R plot 3(b). GP-GSR plot
Figure 3: Diagnostic plots for the spatial regression data
Now we run a spatial regression of attributes on locations. Since our
interest is to understand the neighbourhood instability at consider the first
order difference of attributes and locations as given in columns 4 and 5 of
Table 1. We then run a regression of diff in attributes on diff in location and
the resulting deleted Studentized residuals and leverages are given in columns
2 and 3 of Table 2. Although DSR are very popular outlier measure they fail to
identify even a single observation as outlier. Here the cut-off for the leverage
is 0.2 and it can identify F as a high leverage point. We see exactly the same
picture in the L-R plot as shown in Fig 3(a). Now we compute GSR and GP and
the results are presented in columns 4 and 5 of Table 2. We use BACON
21 | I S I W S C 2 0 1 9