
Page 305 - Special Topic Session (STS) - Volume 1
P. 305
STS441 David B. et al.
(either flows or stocks). To this end, we derive transactions – a flow-perspective
– from the SHS data by taking the first difference between the monthly
reported stocks. To adjust for the difference in reporting frequencies between
the datasets, we then aggregate transactions in the MiFID data to their
monthly sum, netting purchase and selling transactions. The result are two
transformed datasets (SHS* and MiFID*) that show aggregated monthly
transactions of banks on a security-by-security basis. This leaves us with
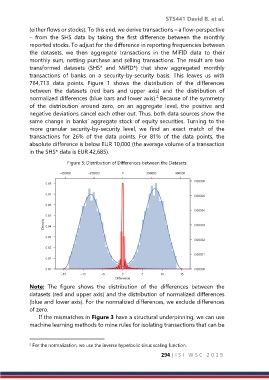
764,713 data points. Figure 1 shows the distribution of the differences
between the datasets (red bars and upper axis) and the distribution of
2
normalized differences (blue bars and lower axis). Because of the symmetry
of the distribution around zero, on an aggregate level, the positive and
negative deviations cancel each other out. Thus, both data sources show the
same change in banks’ aggregate stock of equity securities. Turning to the
more granular security-by-security level, we find an exact match of the
transactions for 26% of the data points. For 81% of the data points, the
absolute difference is below EUR 10,000 (the average volume of a transaction
in the SHS* data is EUR 42,685).
Figure 3: Distribution of Differences between the Datasets
Note: The figure shows the distribution of the differences between the
datasets (red and upper axis) and the distribution of normalized differences
(blue and lower axis). For the normalized differences, we exclude differences
of zero.
If the mismatches in Figure 3 have a structural underpinning, we can use
machine learning methods to mine rules for isolating transactions that can be
2 For the normalization, we use the inverse hyperbolic sinus scaling function.
294 | I S I W S C 2 0 1 9