
Page 308 - Special Topic Session (STS) - Volume 1
P. 308
STS441 David B. et al.
4. Results
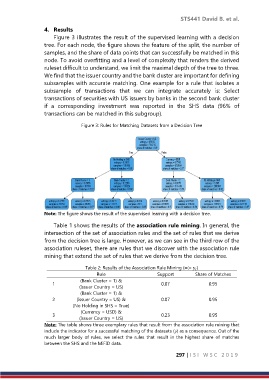
Figure 3 illustrates the result of the supervised learning with a decision
tree. For each node, the figure shows the feature of the split, the number of
samples, and the share of data points that can successfully be matched in this
node. To avoid overfitting and a level of complexity that renders the derived
ruleset difficult to understand, we limit the maximal depth of the tree to three.
We find that the issuer country and the bank cluster are important for defining
subsamples with accurate matching. One example for a rule that isolates a
subsample of transactions that we can integrate accurately is: Select
transactions of securities with US issuers by banks in the second bank cluster
if a corresponding investment was reported in the SHS data (96% of
transactions can be matched in this subgroup).
Figure 3: Rules for Matching Datasets from a Decision Tree
Note: The figure shows the result of the supervised learning with a decision tree.
Table 1 shows the results of the association rule mining. In general, the
intersection of the set of association rules and the set of rules that we derive
from the decision tree is large. However, as we can see in the third row of the
association ruleset, there are rules that we discover with the association rule
mining that extend the set of rules that we derive from the decision tree.
Table 2: Results of the Association Rule Mining (=> )
Rule Support Share of Matches
(Bank Cluster = 1) &
1 0.07 0.95
(Issuer Country = US)
(Bank Cluster = 1) &
2 (Issuer Country = US) & 0.07 0.95
(No Holding in SHS = True)
(Currency = USD) &
3 0.23 0.95
(Issuer Country = US)
Note: The table shows three exemplary rules that result from the association rule mining that
include the indicator for a successful matching of the datasets (y) as a consequence. Out of the
much larger body of rules, we select the rules that result in the highest share of matches
between the SHS and the MiFID data.
297 | I S I W S C 2 0 1 9