
Page 306 - Special Topic Session (STS) - Volume 1
P. 306
STS441 David B. et al.
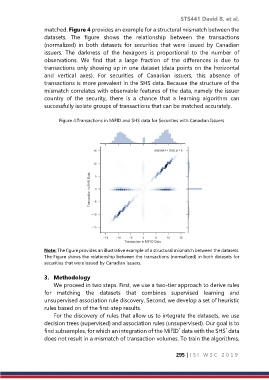
matched. Figure 4 provides an example for a structural mismatch between the
datasets. The figure shows the relationship between the transactions
(normalized) in both datasets for securities that were issued by Canadian
issuers. The darkness of the hexagons is proportional to the number of
observations. We find that a large fraction of the differences is due to
transactions only showing up in one dataset (data points on the horizontal
and vertical axes). For securities of Canadian issuers, this absence of
transactions is more prevalent in the SHS data. Because the structure of the
mismatch correlates with observable features of the data, namely the issuer
country of the security, there is a chance that a learning algorithm can
successfully isolate groups of transactions that can be matched accurately.
Figure 4:Transactions in MiFID and SHS data for Securities with Canadian Issuers
Note: The figure provides an illustrative example of a structural mismatch between the datasets.
The Figure shows the relationship between the transactions (normalized) in both datasets for
securities that were issued by Canadian issuers.
3. Methodology
We proceed in two steps. First, we use a two-tier approach to derive rules
for matching the datasets that combines supervised learning and
unsupervised association rule discovery. Second, we develop a set of heuristic
rules based on of the first-step results.
For the discovery of rules that allow us to integrate the datasets, we use
decision trees (supervised) and association rules (unsupervised). Our goal is to
find subsamples, for which an integration of the MiFID data with the SHS data
*
*
does not result in a mismatch of transaction volumes. To train the algorithms,
295 | I S I W S C 2 0 1 9