
Page 68 - Special Topic Session (STS) - Volume 1
P. 68
STS364 Elena Z. et al.
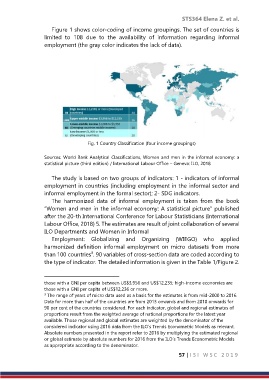
Figure 1 shows color-coding of income groupings. The set of countries is
limited to 108 due to the availability of information regarding informal
employment (the gray color indicates the lack of data).
Fig. 1 Country Classification (four income groupings)
Sources: World Bank Analytical Classifications, Women and men in the informal economy: a
statistical picture (third edition) / International Labour Office – Geneva: ILO, 2018
The study is based on two groups of indicators: 1 - indicators of informal
employment in countries (including employment in the informal sector and
informal employment in the formal sector); 2- SDG indicators.
The harmonized data of informal employment is taken from the book
“Women and men in the informal economy: A statistical picture” published
after the 20-th International Conference for Labour Statisticians (International
Labour Office, 2018) 5. The estimates are result of joint collaboration of several
ILO Departments and Women in Informal
Employment: Globalizing and Organizing (WIEGO) who applied
harmonized definition informal employment on micro datasets from more
3
than 100 countries . 90 variables of cross-section data are coded according to
the type of indicator. The detailed information is given in the Table 1/Figure 2.
those with a GNI per capita between US$3,956 and US$12,235; high-income economies are
those with a GNI per capita of US$12,236 or more.
3 The range of years of micro data used as a basis for the estimates is from mid-2000 to 2016.
Data for more than half of the countries are from 2013 onwards and from 2010 onwards for
90 per cent of the countries considered. For each indicator, global and regional estimates of
proportions result from the weighted average of national proportions for the latest year
available. Those regional and global estimates are weighted by the denominator of the
considered indicator using 2016 data from the ILO’s Trends Econometric Models as relevant.
Absolute numbers presented in the report refer to 2016 by multiplying the estimated regional
or global estimate by absolute numbers for 2016 from the ILO’s Trends Econometric Models
as appropriate according to the denominator.
57 | I S I W S C 2 0 1 9