
Page 63 - Special Topic Session (STS) - Volume 1
P. 63
STS364 Musikhin S.
Table 2 - Structure of the number of employees of enterprises by verbal agreement (informal
employment components),%
Five year population 2014 year 2015 year 2016 year
group
Invoice method t-1 t t-1 t t-1 t
Total 100% 100% 100% 100% 100% 100%
From 15 to 19 years 2.1% 2.0% 3.2% 3.2% 2.4% 2.4%
From 20 to 24 years 17.1% 15.9% 15.6% 15.6% 14.2% 13.2%
From 25 to 29 years 17.4% 17.6% 17.1% 17.1% 15.9% 15.8%
From 30 to 34 years 13.1% 13.6% 13.3% 13.7% 14.5% 14.9%
From 35 to 39 years 11.2% 11.4% 12.9% 13.1% 11.6% 11.9%
From 40 to 44 years 10.5% 10.7% 8.3% 8.5% 9.5% 9.8%
From 45 to 49 years 8.7% 8.4% 7.4% 7.3% 8.1% 8.2%
From 50 to 54 years 8.2% 8.1% 8.5% 8.3% 8.2% 7.8%
From 55 to 59 years 6.8% 7.1% 6.9% 7.0% 8.1% 8.3%
From 60 to 64 years 3.4% 3.5% 4.8% 4.9% 5.6% 5.7%
From 65 to 72 years 1.6% 1.6% 2.2% 2.4% 1.9% 2.1%
Invoice method:
t-1 - Estimate applied by Rosstat, obtained by extending the respondents' answers
to the demographic structure of the population as of January 1 of the year
preceding the observation.
t - Estimate obtained by distributing the respondents' answers to the demographic
structure of the population as of January 1 of the year of the survey (used in ILO
methodological recommendations)
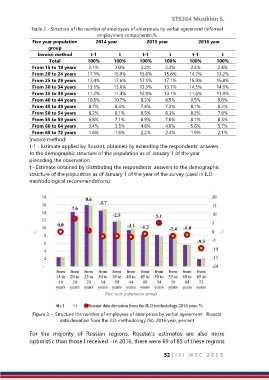
Figure 3. – Structure the number of employees of enterprises by verbal agreement - Rosstat
data deviation from the ILO methodology (%), 2016 year, percent
For the majority of Russian regions, Rosstat’s estimates are also more
optimistic than those I received - in 2016, there were 69 of 85 of these regions
52 | I S I W S C 2 0 1 9