
Page 113 - Special Topic Session (STS) - Volume 2
P. 113
STS463 Noraliza M.A. et al.
sample distribution conform to the external benchmark. The combination of
these weights is then applied to the LFS sample data to obtain estimates of
labour force statistics (DOSM, 2019).
Since the LFS is designed to be representative at the geographical areas of
states as well as urban and rural areas, disaggregation of the estimates by
numerous socio-demographic and economic characteristics must be
interpreted with cautions and subject to relative standard error. In the
meantime, statistics that are not published as well as the micro data are
provided upon request with considerations to the reliability of the related
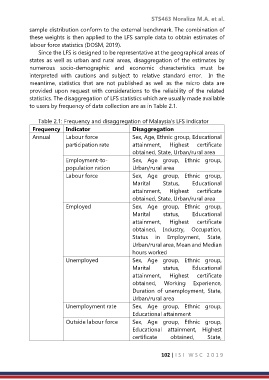
statistics. The disaggregation of LFS statistics which are usually made available
to users by frequency of data collection are as in Table 2.1.
Table 2.1: Frequency and disaggregation of Malaysia’s LFS indicator
Frequency Indicator Disaggregation
Annual Labour force Sex, Age, Ethnic group, Educational
participation rate attainment, Highest certificate
obtained, State, Urban/rural area
Employment-to- Sex, Age group, Ethnic group,
population ration Urban/rural area
Labour force Sex, Age group, Ethnic group,
Marital Status, Educational
attainment, Highest certificate
obtained, State, Urban/rural area
Employed Sex, Age group, Ethnic group,
Marital status, Educational
attainment, Highest certificate
obtained, Industry, Occupation,
Status in Employment, State,
Urban/rural area, Mean and Median
hours worked
Unemployed Sex, Age group, Ethnic group,
Marital status, Educational
attainment, Highest certificate
obtained, Working Experience,
Duration of unemployment, State,
Urban/rural area
Unemployment rate Sex, Age group, Ethnic group,
Educational attainment
Outside labour force Sex, Age group, Ethnic group,
Educational attainment, Highest
certificate obtained, State,
102 | I S I W S C 2 0 1 9