
Page 114 - Special Topic Session (STS) - Volume 2
P. 114
STS463 Noraliza M.A. et al.
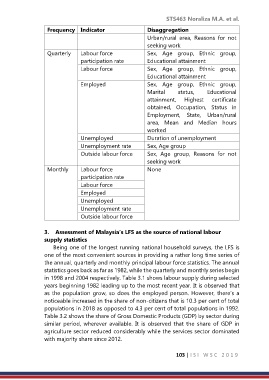
Frequency Indicator Disaggregation
Urban/rural area, Reasons for not
seeking work
Quarterly Labour force Sex, Age group, Ethnic group,
participation rate Educational attainment
Labour force Sex, Age group, Ethnic group,
Educational attainment
Employed Sex, Age group, Ethnic group,
Marital status, Educational
attainment, Highest certificate
obtained, Occupation, Status in
Employment, State, Urban/rural
area, Mean and Median hours
worked
Unemployed Duration of unemployment
Unemployment rate Sex, Age group
Outside labour force Sex, Age group, Reasons for not
seeking work
Monthly Labour force None
participation rate
Labour force
Employed
Unemployed
Unemployment rate
Outside labour force
3. Assessment of Malaysia’s LFS as the source of national labour
supply statistics
Being one of the longest running national household surveys, the LFS is
one of the most convenient sources in providing a rather long time series of
the annual, quarterly and monthly principal labour force statistics. The annual
statistics goes back as far as 1982, while the quarterly and monthly series begin
in 1998 and 2004 respectively. Table 3.1 shows labour supply during selected
years beginning 1982 leading up to the most recent year. It is observed that
as the population grow, so does the employed person. However, there’s a
noticeable increased in the share of non-citizens that is 10.3 per cent of total
populations in 2018 as opposed to 4.3 per cent of total populations in 1992.
Table 3.2 shows the share of Gross Domestic Products (GDP) by sector during
similar period, wherever available. It is observed that the share of GDP in
agriculture sector reduced considerably while the services sector dominated
with majority share since 2012.
103 | I S I W S C 2 0 1 9