
Page 115 - Special Topic Session (STS) - Volume 2
P. 115
STS463 Noraliza M.A. et al.
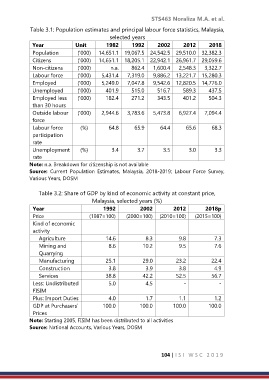
Table 3.1: Population estimates and principal labour force statistics, Malaysia,
selected years
Year Unit 1982 1992 2002 2012 2018
Population ('000) 14,651.1 19,067.5 24,542.5 29,510.0 32,382.3
Citizens ('000) 14,651.1 18,205.1 22,942.1 26,961.7 29,059.6
Non-citizens ('000) n.a. 862.4 1,600.4 2,548.3 3,322.7
Labour force ('000) 5,431.4 7,319.0 9,886.2 13,221.7 15,280.3
Employed ('000) 5,249.0 7,047.8 9,542.6 12,820.5 14,776.0
Unemployed ('000) 401.9 515.0 516.7 589.3 437.5
Employed less ('000) 182.4 271.2 343.5 401.2 504.3
than 30 hours
Outside labour ('000) 2,944.6 3,783.6 5,473.8 6,927.4 7,094.4
force
Labour force (%) 64.8 65.9 64.4 65.6 68.3
participation
rate
Unemployment (%) 3.4 3.7 3.5 3.0 3.3
rate
Note: n.a. Breakdown for citizenship is not available
Source: Current Population Estimates, Malaysia, 2018-2019; Labour Force Survey,
Various Years, DOSM
Table 3.2: Share of GDP by kind of economic activity at constant price,
Malaysia, selected years (%)
Year 1992 2002 2012 2018p
Price (1987=100) (2000=100) (2010=100) (2015=100)
Kind of economic
activity
Agriculture 14.6 8.3 9.8 7.3
Mining and 8.6 10.2 9.5 7.6
Quarrying
Manufacturing 25.1 29.0 23.2 22.4
Construction 3.8 3.9 3.8 4.9
Services 38.8 42.2 52.5 56.7
Less: Undistributed 5.0 4.5 - -
FISIM
Plus: Import Duties 4.0 1.7 1.1 1.2
GDP at Purchasers' 100.0 100.0 100.0 100.0
Prices
Note: Starting 2005, FISIM has been distributed to all activities
Source: National Accounts, Various Years, DOSM
104 | I S I W S C 2 0 1 9