
Page 207 - Special Topic Session (STS) - Volume 2
P. 207
STS480 Firdaus A.A. et al.
This research study uses secondary data as a method of analysis. Data set
was obtained for one month period for trips and events for each vehicle. This
said data was obtained from RUPTELA’s telematic platform which stores
MOBILEYE’s ADAS events data. In total there were 33 drivers who did trips for
the whole month of February 2019 from three logistics companies. These
drivers were categorized into two groups; long haul and short haul drivers.
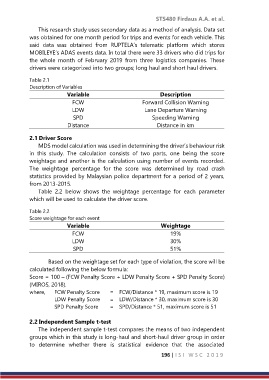
Table 2.1
Description of Variables
Variable Description
FCW Forward Collision Warning
LDW Lane Departure Warning
SPD Speeding Warning
Distance Distance in km
2.1 Driver Score
MDS model calculation was used in determining the driver’s behaviour risk
in this study. The calculation consists of two parts, one being the score
weightage and another is the calculation using number of events recorded.
The weightage percentage for the score was determined by road crash
statistics provided by Malaysian police department for a period of 2 years,
from 2013-2015.
Table 2.2 below shows the weightage percentage for each parameter
which will be used to calculate the driver score.
Table 2.2
Score weightage for each event
Variable Weightage
FCW 19%
LDW 30%
SPD 51%
Based on the weightage set for each type of violation, the score will be
calculated following the below formula:
Score = 100 – (FCW Penalty Score + LDW Penalty Score + SPD Penalty Score)
(MIROS, 2018).
where, FCW Penalty Score = FCW/Distance * 19, maximum score is 19
LDW Penalty Score = LDW/Distance * 30, maximum score is 30
SPD Penalty Score = SPD/Distance * 51, maximum score is 51
2.2 Independent Sample t-test
The independent sample t-test compares the means of two independent
groups which in this study is long-haul and short-haul driver group in order
to determine whether there is statistical evidence that the associated
196 | I S I W S C 2 0 1 9