
Page 208 - Special Topic Session (STS) - Volume 2
P. 208
STS480 Firdaus A.A. et al.
population means are significantly different. Below are the hypotheses for
independent sample t-test used in this study:
0 = ℎ ℎ ℎ ℎ
1 = ℎ ℎ ℎ ℎ
In the sample data in this study, there are two variables: Driver category
and Driver score. The variable Driver category has values of either “0” (Long
haul driver) or "1" (Short haul driver), these will be the independent variables
in this t-test. The variable Driver score is a numeric variable, and it will function
as the dependent variable.
Table 2.3
Description of variables Driver and Driver Score
Variable Description
Driver “0” (Long haul driver) and "1" (Short haul driver)
Driver Score Numeric value in percentage (%)
3. Result
The behaviour of drivers is explained in the table below using simple
descriptive statistics.
Table 3.1
Overall descriptive statistics for two groups
Event Number of Event Triggered
LDW 87709
FCW 6601
SPD 4689
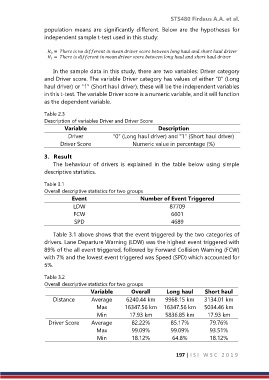
Table 3.1 above shows that the event triggered by the two categories of
drivers. Lane Departure Warning (LDW) was the highest event triggered with
89% of the all event triggered, followed by Forward Collision Warning (FCW)
with 7% and the lowest event triggered was Speed (SPD) which accounted for
5%.
Table 3.2
Overall descriptive statistics for two groups
Variable Overall Long haul Short haul
Distance Average 6240.44 km 9968.15 km 3134.01 km
Max 16347.56 km 16347.56 km 5034.46 km
Min 17.93 km 5836.85 km 17.93 km
Driver Score Average 82.22% 85.17% 79.76%
Max 99.09% 99.09% 93.51%
Min 18.12% 64.8% 18.12%
197 | I S I W S C 2 0 1 9