
Page 236 - Special Topic Session (STS) - Volume 2
P. 236
STS489 Glory A. et al.
() of district
spatially structured, () and unstructured effects
on the log likelihood of hypertension in individual at time and modelled
using the Markov random field (Besag et al, 1991).
3. Results
In this section, we present our findings to understand the spatial
epidemiology of hypertension in South Africa between the period 2008 and
2017 using evidence from the National income dynamics survey data.
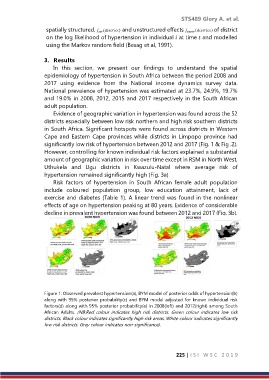
National prevalence of hypertension was estimated at 23.7%, 24.9%, 19.7%
and 19.0% in 2008, 2012, 2015 and 2017 respectively in the South African
adult population.
Evidence of geographic variation in hypertension was found across the 52
districts especially between low risk northern and high risk southern districts
in South Africa. Significant hotspots were found across districts in Western
Cape and Eastern Cape provinces while districts in Limpopo province had
significantly low risk of hypertension between 2012 and 2017 (Fig. 1 & Fig .2).
However, controlling for known individual risk factors explained a substantial
amount of geographic variation in risk over time except in RSM in North West,
Uthukela and Ugu districts in Kwazulu-Natal where average risk of
hypertension remained significantly high (Fig. 3a)
Risk factors of hypertension in South African female adult population
include coloured population group, low education attainment, lack of
exercise and diabetes (Table 1). A linear trend was found in the nonlinear
effects of age on hypertension peaking at 80 years. Evidence of considerable
decline in prevalent hypertension was found between 2012 and 2017 (Fig. 3b).
Figure 1: Observed prevalent hypertension(a), BYM model of posterior odds of hypertension(b)
along with 95% posterior probability(c) and BYM model adjusted for known individual risk
factors(d) along with 95% posterior probability(e) in 2008(left) and 2012(right) among South
African Adults. (NB:Red colour indicates high risk districts. Green colour indicates low risk
districts. Black colour indicates significantly high risk areas. White colour indicates significantly
low risk districts. Grey colour indicates non-significance).
225 | I S I W S C 2 0 1 9