
Page 237 - Special Topic Session (STS) - Volume 2
P. 237
STS489 Glory A. et al.
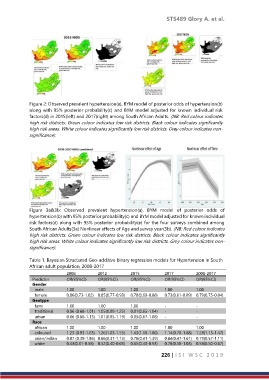
Figure 2: Observed prevalent hypertension(a), BYM model of posterior odds of hypertension(b)
along with 95% posterior probability(c) and BYM model adjusted for known individual risk
factors(d) in 2015(left) and 2017(right) among South African Adults. (NB: Red colour indicates
high risk districts. Green colour indicates low risk districts. Black colour indicates significantly
high risk areas. White colour indicates significantly low risk districts. Grey colour indicates non-
significance).
Figure 3a&3b: Observed prevalent hypertension(a), BYM model of posterior odds of
hypertension(b) with 95% posterior probability(c) and BYM model adjusted for known individual
risk factors(d) along with 95% posterior probability(e) for the four surveys combined among
South African Adults(3a) Nonlinear effects of Age and survey year(3b). (NB: Red colour indicates
high risk districts. Green colour indicates low risk districts. Black colour indicates significantly
high risk areas. White colour indicates significantly low risk districts. Grey colour indicates non-
significance).
Table 1. Bayesian Structured Geo-additive binary regression models for Hypertension in South
African adult population, 2008-2017
2008 2012 2015 2017 2008-2017
Predictor OR(95%CI) OR(95%CI) OR(95%CI) OR(95%CI) OR(95%CI)
Gender
male 1.00 1.00 1.00 1.00 1.00
female 0.86(0.73-1.02) 0.85(0.77-0.93) 0.78(0.69-0.88) 0.73(0.61-0.89) 0.79(0.75-0.84)
Geotype
farm 1.00 1.00 1.00 - -
traditional 0.86 (0.68-1.01) 1.05(0.88-1.25) 0.81(0.65-1.04) - -
urban 0.86 (0.66-1.13) 1.01(0.85-1.19) 0.85(0.67-1.08) - -
Race
african 1.00 1.00 1.00 1.00 1.00
coloured 1.23 (0.93-1.63) 1.26(1.03-1.55) 1.43(1.10-1.86) 1.14(0.78-1.68) 1.28(1.13-1.47)
asian/indian 0.87 (0.39-1.86) 0.66(0.37-1.13) 0.76(0.41-1.39) 0.84(0.47-1.61) 0.79(0.57-1.11)
white 0.43(0.31-0.58) 0.52(0.40-0.69) 0.65(0.43-0.93) 0.78(0.58-1.03) 0.58(0.50-0.67)
226 | I S I W S C 2 0 1 9