
Page 239 - Special Topic Session (STS) - Volume 2
P. 239
STS489 Glory A. et al.
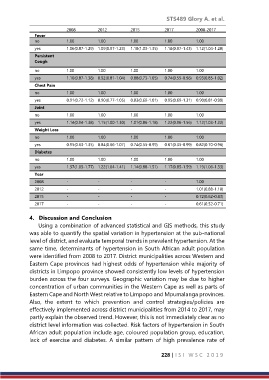
2008 2012 2015 2017 2008-2017
Fever
no 1.00 1.00 1.00 1.00 1.00
yes 1.06(0.87-1.29) 1.09(0.97-1.23) 1.18(1.03-1.35) 1.18(0.97-1.43) 1.12(1.04-1.20)
Persistent
Cough
no 1.00 1.00 1.00 1.00 1.00
yes 1.10(0.87-1.38) 0.92(0.81-1.04) 0.88(0.73-1.05) 0.74(0.55-0.98) 0.93(0.85-1.02)
Chest Pain
no 1.00 1.00 1.00 1.00 1.00
yes 0.91(0.72-1.12) 0.90(0.77-1.05) 0.83(0.69-1.01) 0.95(0.69-1.31) 0.90(0.81-0.99)
Joint
Pain/Arthritis 1.00 1.00 1.00 1.00 1.00
no
yes 1.14(0.94-1.38) 1.15(1.00-1.30) 1.01(0.86-1.18) 1.22(0.96-1.56) 1.12(1.03-1.22)
Weight Loss
no 1.00 1.00 1.00 1.00 1.00
yes 0.95(0.63-1.35) 0.84(0.66-1.07) 0.74(0.55-0.99) 0.61(0.35-0.99) 0.82(0.70-0.96)
Diabetes
no 1.00 1.00 1.00 1.00 1.00
yes 1.37(1.05-1.77) 1.22(1.04-1.41) 1.14(0.88-1.51) 1.17(0.85-1.59) 1.19(1.06-1.33)
Year
2008 - - - - 1.00
2012 - - - - 1.01(0.88-1.18)
2015 - - - - 0.72(0.62-0.83)
2017 - - - - 0.61(0.52-0.71)
4. Discussion and Conclusion
Using a combination of advanced statistical and GIS methods, this study
was able to quantify the spatial variation in hypertension at the sub-national
level of district, and evaluate temporal trends in prevalent hypertension. At the
same time, determinants of hypertension in South African adult population
were identified from 2008 to 2017. District municipalities across Western and
Eastern Cape provinces had highest odds of hypertension while majority of
districts in Limpopo province showed consistently low levels of hypertension
burden across the four surveys. Geographic variation may be due to higher
concentration of urban communities in the Western Cape as well as parts of
Eastern Cape and North West relative to Limpopo and Mpumalanga provinces.
Also, the extent to which prevention and control strategies/policies are
effectively implemented across district municipalities from 2014 to 2017, may
partly explain the observed trend. However, this is not immediately clear as no
district level information was collected. Risk factors of hypertension in South
African adult population include age, coloured population group, education,
lack of exercise and diabetes. A similar pattern of high prevalence rate of
228 | I S I W S C 2 0 1 9