Page 256 - Special Topic Session (STS) - Volume 2
P. 256

STS489 Danielle J.R. et al.
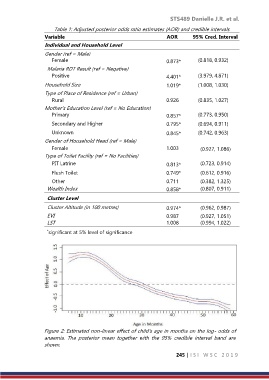
                      Table 1: Adjusted posterior odds ratio estimates (AOR) and credible intervals
                  Variable                                       AOR       95% Cred. Interval
                  Individual and Household Level
                  Gender (ref = Male)
                     Female                                      0.873*      (0.818, 0.932)
                   Malaria RDT Result (ref = Negative)
                     Positive                                    4.401*      (3.979, 4.871)
                  Household Size                                 1.019*      (1.008, 1.030)
                  Type of Place of Residence (ref = Urban)
                     Rural                                       0.926       (0.835, 1.027)
                  Mother’s Education Level (ref = No Education)
                     Primary                                     0.857*      (0.773, 0.950)

                     Secondary and Higher                        0.795*      (0.694, 0.911)
                     Unknown                                     0.845*      (0.742, 0.963)
                  Gender of Household Head (ref = Male)
                     Female                                      1.003        (0.927, 1.086)
                  Type of Toilet Facility (ref = No Facilities)
                     PIT Latrine                                 0.813*       (0.723, 0.914)
                     Flush Toilet                                0.749*       (0.612, 0.916)
                     Other                                       0.711        (0.382, 1.325)
                   Wealth Index                                  0.858*       (0.807, 0.911)

                   Cluster Level
                   Cluster Altitude (in 100 metres)              0.974*       (0.962, 0.987)
                   EVI                                           0.987        (0.927, 1.051)
                   LST                                           1.008        (0.994, 1.022)

                   * significant at 5% level of significance
                     \


                  Figure 2: Estimated non-linear effect of child’s age in months on the log- odds of
                  anaemia.  The  posterior  mean  together  with  the  95%  credible  interval  band  are
                  shown.
                                                                     245 | I S I   W S C   2 0 1 9
   251   252   253   254   255   256   257   258   259   260   261