
Page 384 - Special Topic Session (STS) - Volume 2
P. 384
STS506 L. Leticia R. et al.
3.2 Surrogate model A: “Mass action”
Since the replacement number is related to how the number of cases
increase in a very large population, it seems reasonable to try to approximate
the network epidemic model by a deterministic model (1) with parameters that
reproduce this number. If we select the parameters and in (1) with values
= ( ) and = + , then we have R= Rnet. Then at each step of the ABC-
1
MCMC, we replace the agent-based simulation for the proposed parameter
= ( , ) by the numerical solution to the deterministic model with parameters
̅̅̅
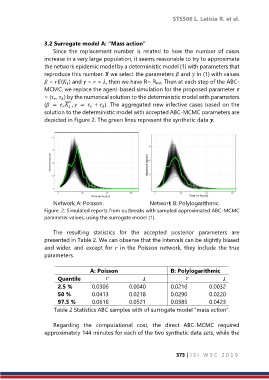
( = , = + ). The aggregated new infective cases based on the
1
solution to the deterministic model with accepted ABC-MCMC parameters are
depicted in Figure 2. The green lines represent the synthetic data .
Network A: Poisson. Network B: Polylogarithmic.
Figure. 2: Simulated reports from outbreaks with sampled approximated ABC-MCMC
parameter values, using the surrogate model (1).
The resulting statistics for the accepted posterior parameters are
presented in Table 2. We can observe that the intervals can be slightly biased
and wider, and except for in the Poisson network, they include the true
parameters.
A: Poisson B: Polylogarithmic
Quantile
2.5 % 0.0306 0.0040 0.0216 0.0032
50 % 0.0413 0.0218 0.0290 0.0220
97.5 % 0.0616 0.0521 0.0385 0.0423
Table 2 Statistics ABC samples with of surrogate model “mass action”.
Regarding the computational cost, the direct ABC-MCMC required
approximately 144 minutes for each of the two synthetic data sets, while the
373 | I S I W S C 2 0 1 9