
Page 53 - Special Topic Session (STS) - Volume 2
P. 53
STS452 Joseph M.
A defining contribution of the input–output system—from the tables to
the Leontief inverse—to economic analysis is the quantified mapping of the
continuum of linkages and relationships between production and trade,
making it the ideal framework for studying the globalized production
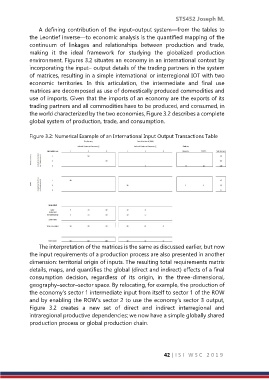
environment. Figures 3.2 situates an economy in an international context by
incorporating the input– output details of the trading partners in the system
of matrices, resulting in a simple international or interregional IOT with two
economic territories. In this articulation, the intermediate and final use
matrices are decomposed as use of domestically produced commodities and
use of imports. Given that the imports of an economy are the exports of its
trading partners and all commodities have to be produced, and consumed, in
the world characterized by the two economies, Figure 3.2 describes a complete
global system of production, trade, and consumption.
Figure 3.2: Numerical Example of an International Input Output Transactions Table
The interpretation of the matrices is the same as discussed earlier, but now
the input requirements of a production process are also presented in another
dimension: territorial origin of inputs. The resulting total requirements matrix
details, maps, and quantifies the global (direct and indirect) effects of a final
consumption decision, regardless of its origin, in the three-dimensional,
geography–sector–sector space. By relocating, for example, the production of
the economy’s sector 1 intermediate input from itself to sector 1 of the ROW
and by enabling the ROW’s sector 2 to use the economy’s sector 3 output,
Figure 3.2 creates a new set of direct and indirect interregional and
intraregional productive dependencies; we now have a simple globally shared
production process or global production chain.
42 | I S I W S C 2 0 1 9