
Page 56 - Special Topic Session (STS) - Volume 2
P. 56
STS452 Joseph M.
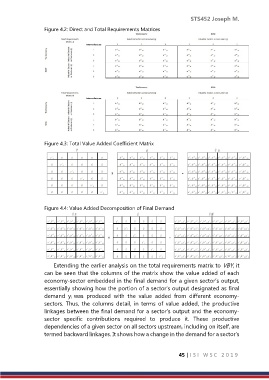
Figure 4.2: Direct and Total Requirements Matrices
Figure 4.3: Total Value Added Coefficient Matrix
Figure 4.4: Value Added Decomposition of Final Demand
Extending the earlier analysis on the total requirements matrix to VBY, it
can be seen that the columns of the matrix show the value added of each
economy-sector embedded in the final demand for a given sector’s output,
essentially showing how the portion of a sector’s output designated as final
demand yi was produced with the value added from different economy-
sectors. Thus, the columns detail, in terms of value added, the productive
linkages between the final demand for a sector’s output and the economy-
sector specific contributions required to produce it. These productive
dependencies of a given sector on all sectors upstream, including on itself, are
termed backward linkages. It shows how a change in the demand for a sector’s
45 | I S I W S C 2 0 1 9