
Page 189 - Special Topic Session (STS) - Volume 3
P. 189
STS539 Muhammad Abid et al.
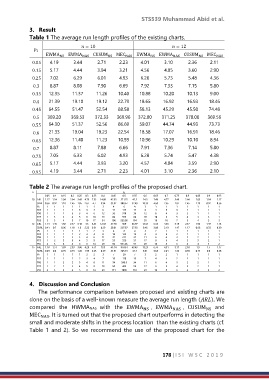
3. Result
Table 1 The average run length profiles of the existing charts.
= 10 = 12
1
EWMA NS EWMA NAS CUSUM NS MEC NAS EWMA NS EWMA NAS CUSUM NS MEC NAS
0.05 4.19 3.44 2.71 2.23 4.01 3.10 2.36 2.11
0.15 5.17 4.44 3.94 3.21 4.56 4.05 3.60 2.90
0.25 7.02 6.29 6.01 4.93 6.26 5.73 5.48 4.36
0.3 8.87 8.08 7.90 6.69 7.92 7.33 7.15 5.80
0.35 12.35 11.37 11.26 10.40 10.88 10.20 10.13 9.00
0.4 21.39 19.10 19.12 22.79 18.65 16.92 16.93 18.46
0.45 64.55 51.47 52.54 88.58 58.13 45.29 45.50 74.48
0.5 369.20 369.53 372.33 369.96 372.00 371.25 370.00 369.56
0.55 64.30 51.37 52.56 86.69 59.07 44.74 44.93 73.73
0.6 21.33 19.04 19.23 22.54 18.58 17.07 16.91 18.46
0.65 12.36 11.40 11.23 10.59 10.96 10.29 10.10 8.94
0.7 8.87 8.11 7.88 6.66 7.91 7.36 7.14 5.80
0.75 7.05 6.33 6.02 4.93 6.28 5.74 5.47 4.38
0.85 5.17 4.44 3.93 3.20 4.57 4.04 3.59 2.90
0.95 4.19 3.44 2.71 2.23 4.01 3.10 2.36 2.10
Table 2 The average run length profiles of the proposed chart.
n
0.05 0.1 0.15 0.2 0.25 0.3 0.35 0.4 0.45 0.5 0.55 0.6 0.65 0.7 0.75 0.8 0.85 0.9 0.95
10 ARL 1.17 1.54 2.04 2.64 3.49 4.79 7.53 14.08 42.93 371.75 42.3 14.3 7.49 4.77 3.48 2.64 2.03 1.54 1.17
SDRL 0.56 0.92 1.18 1.45 1.85 2.67 4.7 9.94 33.31 308.67 32.49 10.33 4.68 2.65 1.87 1.45 1.19 0.92 0.56
P5 1 1 1 1 1 1 1 3 4 6 4 3 1 1 1 1 1 1 1
P25 1 1 1 1 3 3 4 6 17 114 17 6 4 3 3 1 1 1 1
P50 1 1 1 3 3 4 6 12 36 310 36 12 6 4 3 3 1 1 1
P75 1 3 3 4 5 6 10 19 60 559 60 20 10 6 5 4 3 3 1
P95 3 3 4 5 7 10 17 34 106 955.05 104 35 16 10 7 5 4 3 3
12 ARL 1.14 1.45 1.92 2.47 3.18 4.3 6.54 12.34 37.78 369 36.97 12.54 6.53 4.33 3.19 2.47 1.92 1.47 1.13
SDRL 0.41 0.7 0.96 1.18 1.5 2.22 3.91 8.29 28.61 297.87 27.92 8.45 3.88 2.19 1.47 1.17 0.96 0.72 0.39
P5 1 1 1 1 1 1 2 3 4 8 4 3 2 1 1 1 1 1 1
P25 1 1 1 1 2 3 4 6 16 122 16 6 4 3 2 1 1 1 1
P50 1 1 2 3 3 4 6 11 32 311 31 11 6 4 3 2 2 1 1
P75 1 2 3 3 4 5 9 17 53 556 51 17 8 6 4 3 3 2 1
P95 2 3 4 4 6 8 14 29 94 935.05 91 29 14 8 6 4 4 3 2
15 ARL 1.18 1.51 1.89 2.39 3.06 4.28 6.71 13.3 43.14 370.61 43.43 13.23 6.76 4.31 3.11 2.38 1.9 1.5 1.17
SDRL 0.39 0.6 0.75 0.94 1.26 1.99 3.65 8.39 34.51 405.49 34.4 8.31 3.65 2.01 1.32 0.93 0.74 0.6 0.38
P5 1 1 1 1 1 2 2 3 7 20 7 3 2 2 1 1 1 1 1
P25 1 1 1 2 2 3 4 7 18 110 19 7 4 3 2 2 1 1 1
P50 1 1 2 2 3 4 6 11 34 248.5 34 11 6 4 3 2 2 1 1
P75 1 2 2 3 4 5 8 18 58 485 59 17 9 5 4 3 2 2 1
P95 2 3 3 4 5 8 14 29 111 1086 110 29 14 8 6 4 3 3 2
4. Discussion and Conclusion
The performance comparison between proposed and existing charts are
done on the basis of a well-known measure the average run length (). We
compared the HWMANAS with the EWMA NS , EWMA NAS , CUSUM NS and
MEC NAS . It is turned out that the proposed chart outperforms in detecting the
small and moderate shifts in the process location than the existing charts (cf.
Table 1 and 2). So we recommend the use of the proposed chart for the
178 |I S I W S C 2 0 1 9