
Page 307 - Special Topic Session (STS) - Volume 3
P. 307
STS544 M. Camachoa et al.
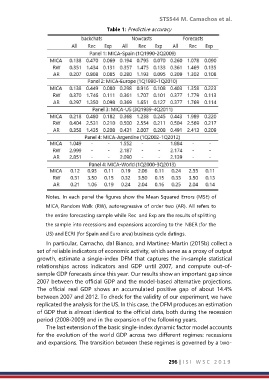
Table 1: Predictive accuracy
Notes. In each panel the figures show the Mean Squared Errors (MSE) of
MICA, Random Walk (RW), autoregressive of order two (AR). All refers to
the entire forecasting sample while Rec and Exp are the results of splitting
the sample into recessions and expansions according to the NBER (for the
US) and ECRI (for Spain and Euro area) business cycle datings.
In particular, Camacho, dal Bianco, and Martínez-Martín (2015b) collect a
set of reliable indicators of economic activity, which serve as a proxy of output
growth, estimate a single-index DFM that captures the in-sample statistical
relationships across indicators and GDP until 2007, and compute out-of-
sample GDP forecasts since this year. Our results show an important gap since
2007 between the official GDP and the model-based alternative projections.
The official real GDP shows an accumulated positive gap of about 14.4%
between 2007 and 2012. To check for the validity of our experiment, we have
replicated the analysis for the US. In this case, the DFM produces an estimation
of GDP that is almost identical to the official data, both during the recession
period (2008-2009) and in the expansion of the following years.
The last extension of the basic single-index dynamic factor model accounts
for the evolution of the world GDP across two different regimes: recessions
and expansions. The transition between these regimes is governed by a two-
296 | I S I W S C 2 0 1 9