
Page 243 - Special Topic Session (STS) - Volume 4
P. 243
STS583 Daniel C.
Brahmaputra (GBM) River Basin. The assessment involved official statistics on
population and poverty from four countries (Bangladesh, Bhutan, India, and
Nepal). One requirement for the methodology was flexibility of scale.
A grid-based extrapolation of location of residence of poor households
in the GBM was developed utilizing household survey data [4] combined with
geospatial data sets, particularly the GUF [German Aerospace Centre] and
visible night lights.[NOAA] The modelled extrapolation of location of poverty
is overlaid with flood hazard areas, defined according to hazard maps
provided by UNISDR [5], providing an isolated view of relationships between
vulnerability associated with extreme poverty and exposure to a potential
environmental hazard.
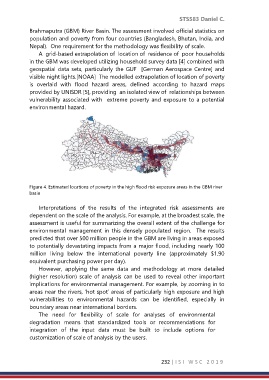
Figure 4. Estimated locations of poverty in the high flood risk exposure areas in the GBM river
basin
Interpretations of the results of the integrated risk assessments are
dependent on the scale of the analysis. For example, at the broadest scale, the
assessment is useful for summarizing the overall extent of the challenge for
environmental management in this densely populated region. The results
predicted that over 500 million people in the GBM are living in areas exposed
to potentially devastating impacts from a major flood, including nearly 100
million living below the international poverty line (approximately $1.90
equivalent purchasing power per day).
However, applying the same data and methodology at more detailed
(higher resolution) scale of analysis can be used to reveal other important
implications for environmental management. For example, by zooming in to
areas near the rivers, ‘hot spot’ areas of particularly high exposure and high
vulnerabilities to environmental hazards can be identified, especially in
boundary areas near international borders.
The need for flexibility of scale for analyses of environmental
degradation means that standardized tools or recommendations for
integration of the input data must be built to include options for
customization of scale of analysis by the users.
232 | I S I W S C 2 0 1 9