
Page 251 - Special Topic Session (STS) - Volume 4
P. 251
STS583 Michael W. et al.
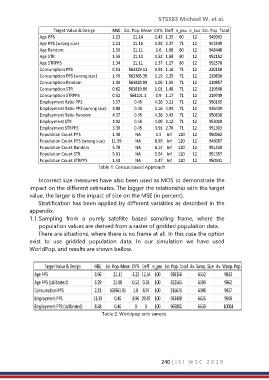
Target Value & Design MSE Est. Pop. Mean CV% Deff n_psu n_ssu Est. Pop. Total
Age PPS 1.23 21.14 1.43 1.35 80 12 949363
Age PPS (wrong size) 2.21 21.16 1.92 2.37 71 12 943549
Age Random 1.56 21.11 1.6 1.68 80 12 948448
Age STR 1.56 21.13 1.52 1.58 80 12 952152
Age STRPPS 1.34 21.11 1.37 1.27 80 12 952578
Consumption PPS 0.91 563329.11 0.91 1.16 71 12 220150
Consumption PPS (wrong size) 1.45 563365.35 1.19 2.29 71 12 219830
Consumption Random 1.06 563828.89 1.05 1.59 71 12 219857
Consumption STR 0.62 563819.86 1.01 1.48 71 12 219568
Consumption STRPPS 0.52 564101.1 0.9 1.17 71 12 219749
Employment Ratio PPS 3.57 0.45 4.26 3.21 71 12 950165
Employment Ratio PPS (wrong size) 4.88 0.45 5.16 4.93 71 12 936439
Employment Ratio Random 4.37 0.45 4.38 3.43 71 12 950630
Employment STR 4.02 0.46 4.09 3.12 71 12 953019
Employment STRPPS 3.36 0.45 3.91 2.76 71 12 951303
Population Count PPS 1.38 NA 1.5 Inf 120 12 950962
Population Count PPS (wrong size) 11.99 NA 8.93 Inf 120 12 946087
Population Count Random 5.78 NA 6.14 Inf 120 12 951510
Population Count STR 5.01 NA 5.54 Inf 120 12 951357
Population Count STRPPS 1.44 NA 1.47 Inf 120 12 950941
Table 1: Census based Approach
Incorrect size measures have also been used as MOS to demonstrate the
impact on the different estimates. The bigger the relationship with the target
value, the larger is the impact of size on the MSE (in percent).
Stratification has been applied by different variables as described in the
appendix.
1.1. Sampling from a purely satellite based sampling frame, where the
population values are derived from a raster of gridded population data.
There are situations, where there is no frame at all. In this case the option
exist to use gridded population data. In our simulation we have used
WorldPop, and results are shown bellow.
Target Value & Design MSE Est. Pop. Mean CV% Deff n_psu Est. Pop. Total Av. Samp. Size Av. Wpop. Pop
Age PPS 3.96 21.11 3.22 12.54 100 938156 6552 9833
Age PPS (calibrated) 3.29 21.08 0.52 0.33 100 922565 6593 9962
Consumption PPS 2.21 563961.95 1.8 8.97 100 215671 6598 9927
Employment PPS 11.39 0.46 8.96 29.47 100 933408 6626 9948
Employment PPS (calibrated) 8.68 0.46 0 0 100 965882 6630 10004
Table 2: Worldpop only sample
240 | I S I W S C 2 0 1 9