
Page 252 - Special Topic Session (STS) - Volume 4
P. 252
STS583 Michael W. et al.
1.2. Linking of the satellite-based population data as well as the land coverage
data to the available georeferenced census-based enumeration areas
(hybrid approach).
In this section we apply an option, which allows to draw a sample from a
combination of geo-referenced enumeration areas and different remotely
sensed data.
This situation arises, when either the census data is expected to be severely
outdated, or when only the geo-referenced units but no other census data is
accessible. We have produced the same population estimates, by either a pure
PPS (PPS) design or a stratified PPS (STRPPS) and with or without calibration
to known population totals. Calibration has been implemented at the
household level, which preserves equal weights for all household members.
The MOS was the ratio of built-up area to the total EA’s area. To further
improve the estimates, the sample includes an additional stratification, by
built-up area into 3 strata, and sampling units are proportionally allocated.
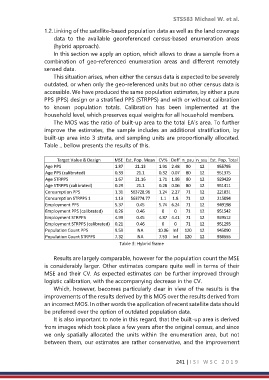
Table .. bellow presents the results of this.
Target Value & Design MSE Est. Pop. Mean CV% Deff n_psu n_ssu Est. Pop. Total
Age PPS 1.87 21.13 1.91 2.48 80 12 955795
Age PPS (calibrated) 0.33 21.1 0.32 0.07 80 12 951375
Age STRPPS 1.67 21.16 1.71 1.98 80 12 929429
Age STRPPS (calibrated) 0.29 21.1 0.28 0.06 80 12 951411
Consumption PPS 1.31 563728.96 1.24 2.27 71 12 221831
Consumption STRPPS 1 1.13 563774.77 1.1 1.8 71 12 215094
Employment PPS 5.37 0.45 5.74 6.24 71 12 949198
Employment PPS (calibrated) 0.26 0.46 0 0 71 12 951542
Employment STRPPS 4.99 0.45 4.87 4.41 71 12 929512
Employment STRPPS (calibrated) 0.21 0.46 0 0 71 12 951293
Population Count PPS 9.59 NA 10.06 Inf 120 12 945090
Population Count STRPPS 7.32 NA 7.53 Inf 120 12 936555
Table 3: Hybrid frame
Results are largely comparable, however for the population count the MSE
is considerably larger. Other estimates compare quite well in terms of their
MSE and their CV. As expected estimates can be further improved through
logistic calibration, with the accompanying decrease in the CV.
Which, however, becomes particularly clear in view of the results is the
improvements of the results derived by this MOS over the results derived from
an incorrect MOS. In other words the application of recent satellite data should
be preferred over the option of outdated population data.
It is also important to note in this regard, that the built-up area is derived
from images which took place a few years after the original census, and since
we only spatially allocated the units within the enumeration area, but not
between them, our estimates are rather conservative, and the improvement
241 | I S I W S C 2 0 1 9