
Page 381 - Special Topic Session (STS) - Volume 4
P. 381
STS2319 Lakshman N. R. et al.
“Fusion NDVI SG Fit” despite the lower user’s accuracy and the relatively low
overall accuracy. By merging all the maps from the four inputs, the derived
final land cover map shows accuracy levels similar to the “Landsat + ALOS-2”
input (Figure 2). Figure 3 shows the final land cover classification map
produced by merging the four inputs.
C. Paddy Rice Mapping
The overall accuracy associated with classifying landcover of Thai Binh
using four different inputs are ranked from high to low as: () “Landsat + ALOS-
2”, ② “Landsat Only”, ③ “Fusion NDVI SG Fit”, and ④ “ALOS-2 Only”. The
difference between the first two inputs, “Landsat + ALOS-2” and “Landsat
Only” is small, 0.77±0.02 versus 0.76±0.02. For the class of our main interest
here, paddy rice, user’s accuracy follows the same ranking order across the
four inputs. The producer’s accuracy of paddy rice is the highest for the input
“Fusion NDVI SG Fit” despite the lower user’s accuracy and the relatively low
overall accuracy. By merging all the maps from the four inputs, the derived
final land cover map shows accuracy levels similar to the “Landsat + ALOS-2”
input (Figure 2). Figure 3 shows the final land cover classification map
produced by merging the four inputs.
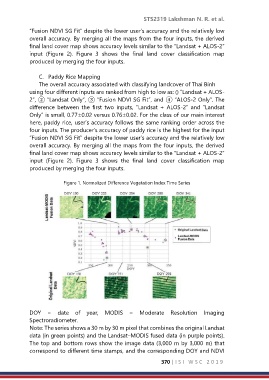
Figure 1. Normalized Difference Vegetation Index Time Series
DOY = date of year, MODIS = Moderate Resolution Imaging
Spectroradiometer.
Note: The series shows a 30 m by 30 m pixel that combines the original Landsat
data (in green points) and the Landsat–MODIS fused data (in purple points).
The top and bottom rows show the image data (3,000 m by 3,000 m) that
correspond to different time stamps, and the corresponding DOY and NDVI
370 | I S I W S C 2 0 1 9