
Page 383 - Special Topic Session (STS) - Volume 4
P. 383
STS2319 Lakshman N. R. et al.
bars) from those field subplots that are not used in our regression and their
area weights within the province given by the statistical extrapolation of field
samples. The field-sampling-based distribution is bimodal at approximately
from 5.0 t/ha to 5.70 t/ha, if we assume a normal distribution of crop yield.
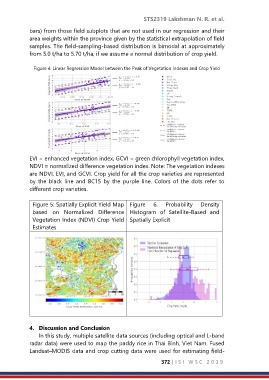
Figure 4. Linear Regression Model between the Peak of Vegetation Indexes and Crop Yield
EVI = enhanced vegetation index, GCVI = green chlorophyll vegetation index,
NDVI = normalized difference vegetation index. Note: The vegetation indexes
are NDVI, EVI, and GCVI. Crop yield for all the crop varieties are represented
by the black line and BC15 by the purple line. Colors of the dots refer to
different crop varieties.
Figure 5: Spatially Explicit Yield Map Figure 6. Probability Density
based on Normalized Difference Histogram of Satellite-Based and
Vegetation Index (NDVI) Crop Yield Spatially Explicit
Estimates
4. Discussion and Conclusion
In this study, multiple satellite data sources (including optical and L-band
radar data) were used to map the paddy rice in Thai Binh, Viet Nam. Fused
Landsat–MODIS data and crop cutting data were used for estimating field-
372 | I S I W S C 2 0 1 9