
Page 382 - Special Topic Session (STS) - Volume 4
P. 382
STS2319 Lakshman N. R. et al.
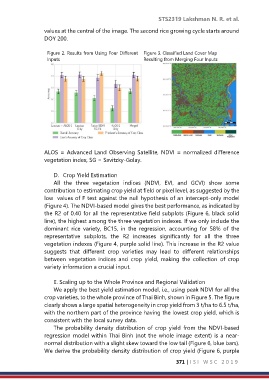
values at the central of the image. The second rice growing cycle starts around
DOY 200.
Figure 2. Results from Using Four Different Figure 3. Classified Land Cover Map
Inputs Resulting from Merging Four Inputs
ALOS = Advanced Land Observing Satellite, NDVI = normalized difference
vegetation index, SG = Savitzky-Golay.
D. Crop Yield Estimation
All the three vegetation indices (NDVI, EVI, and GCVI) show some
contribution to estimating crop yield at field or pixel level, as suggested by the
low values of F test against the null hypothesis of an intercept-only model
(Figure 4). The NDVI-based model gives the best performance, as indicated by
the R2 of 0.40 for all the representative field subplots (Figure 6, black solid
line), the highest among the three vegetation indexes. If we only include the
dominant rice variety, BC15, in the regression, accounting for 58% of the
representative subplots, the R2 increases significantly for all the three
vegetation indexes (Figure 4, purple solid line). This increase in the R2 value
suggests that different crop varieties may lead to different relationships
between vegetation indices and crop yield, making the collection of crop
variety information a crucial input.
E. Scaling up to the Whole Province and Regional Validation
We apply the best yield estimation model, i.e., using peak NDVI for all the
crop varieties, to the whole province of Thai Binh, shown in Figure 5. The figure
clearly shows a large spatial heterogeneity in crop yield from 3 t/ha to 6.5 t/ha,
with the northern part of the province having the lowest crop yield, which is
consistent with the local survey data.
The probability density distribution of crop yield from the NDVI-based
regression model within Thai Binh (not the whole image extent) is a near-
normal distribution with a slight skew toward the low tail (Figure 6, blue bars).
We derive the probability density distribution of crop yield (Figure 6, purple
371 | I S I W S C 2 0 1 9