Page 407 - Special Topic Session (STS) - Volume 4
P. 407
STS2320 Mohamed A I.
            to  the  small  sample  size  (134  countries),  but  those  variables  with  severe
            skewness  and/or  severe  kurtosis  required  statistical  treatment  before  they
            could be employed, see Groeneveld, R.A., and G. Meeden (1984). Variables
            with one to five outliers were winsorized, whereby those values considered
            outliers were assigned the next highest value until the skewness and kurtosis
            were brought into acceptable ranges. However, five variables with more than
            five outliers required additional calculation and were treated using logarithm
            and the square root transformations, see Cornell University et al. (2017).
            The value of a variable was considered an outlier if its instance fell outside the
            range of the specific data fence defined as follows:

                       Lower bound = first quartile – 1.5 X interquartile range
                       Upper bound = third quartile + 1.5 X interquartile range

            Outliers were treated by replacing each outlier with the second highest value
            in the case of high values, or the second lowest value in the case of low values.

                Normalization
                The rescaling or ‘maximum–minimum’ method was used for normalization.
            The values of variables were normalized into the 0–100 range, in which higher
            values  indicated  better  results.  The  normalization  criterion  depends  on
            whether the variable is good (has a positive relation with the overall Index) or
            bad (has a negative relation with the overall Index). The good variables were
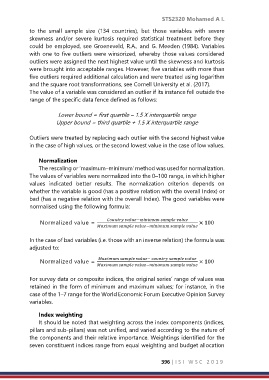
            normalised using the following formula:

                Normalized value =         −    × 100
                                        −

            In the case of bad variables (i.e. those with an inverse relation) the formula was
            adjusted to:


                Normalized value =       −     × 100
                                        −

            For survey data or composite indices, the original series’ range of values was
            retained in the form of minimum and maximum values; for instance, in the
            case of the 1–7 range for the World Economic Forum Executive Opinion Survey
            variables.

                Index weighting
                It should be noted that weighting across the index components (indices,
            pillars and sub-pillars) was not unified, and varied according to the nature of
            the components and their relative importance. Weightings identified for the
            seven constituent indices range from equal weighting and budget allocation


                                                               396 | I S I   W S C   2 0 1 9

