
Page 17 - Contributed Paper Session (CPS) - Volume 2
P. 17
CPS1407 D.Dilshanie Deepawansa et al.
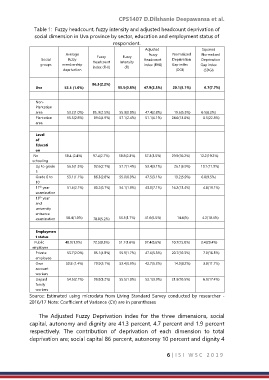
Table 1: Fuzzy headcount, fuzzy intensity and adjusted headcount deprivation of
social dimension in Uva province by sector, education and employment status of
respondent.
Adjusted Squared
Average Fuzzy Normalized Normalized
Social fuzzy Fuzzy Fuzzy Headcount Deprivation Deprivation
groups membership Headcount Intensity index (FH0) Gap index Gap index
index (FHI)
(FI)
deprivation (DGI) (SDGI)
86.3(2.2%)
Uva 53.5 (1.0%) 55.5(0.8%) 47.9(2.5%) 20.1(5.1%) 6.7(7.7%)
Non-
Plantation
area 53.2(1.0%) 85..9(2.5%) 55.3(0.8%) 47.4(2.8%) 19.6(5.5%) 6.5(8.2%)
Plantation 55.5(2.8%) 89.6(4.9%) 57.1(2.4%) 51.1(6.1%) 24.0(13.8%) 8.5(22.8%)
area
Level
of
Educati
on
No 58.4 (2.4%) 97.4(2.7%) 58.8(2.3%) 57.3(3.5%) 29.9(10.2%) 12.2(19.2%)
schooling
Up to grade 56.5(1.5%) 92.6(2.7%) 57.7(1.4%) 53.4(3.1%) 26.1(6.9%) 10.1(11.9%)
5
Grade 6 to 53.1(1.1%) 86.3(2.8%) 55.0(0.9%) 47.5(3.1%) 19.2(5.9%) 6.0(9.5%)
10
11 year 51.6(2.1%) 80.2(6.7%) 54.1(1.9%) 43.3(7.1%) 16.2(13.4%) 4.8(19.1%)
th
examination
th
13 year
and
university
entrance
examination 50.4(1.9%) 78.0(5.2%) 53.3(1.7%) 41.6(5.5%) 14.4(%) 4.2(18.4%)
Employmen
t status
Public 48.9(1.9%) 72.5(8.3%) 51.7(1.6%) 37.4(8.6%) 10.7(15.8%) 2.4(29.4%)
employee
Private 53.7(2.0%) 85.1(4.8%) 55.9(1.7%) 47.6(5.3%) 20.7(10.3%) 7.0(16.3%)
employee
Own 50.8 (1.4%) 79.9(5.1%) 53.4(0.9%) 42.7(5.3%) 14.9(8.2%) 3.8(11.7%)
account
workers
Unpaid 54.5(2.1%) 93.8(3.2%) 55.5(1.8%) 52.1(3.9%) 21.9(10.5%) 6.9(17.4%)
family
workers
Source: Estimated using microdata from Living Standard Survey conducted by researcher -
2016/17 Note: Coefficient of Variance (CV) are in parentheses
The Adjusted Fuzzy Deprivation index for the three dimensions, social
capital, autonomy and dignity are 41.3 percent, 4.7 percent and 1.9 percent
respectively. The contribution of deprivation of each dimension to total
deprivation are; social capital 86 percent, autonomy 10 percent and dignity 4
6 | I S I W S C 2 0 1 9