
Page 18 - Contributed Paper Session (CPS) - Volume 2
P. 18
CPS1407 D.Dilshanie Deepawansa et al.
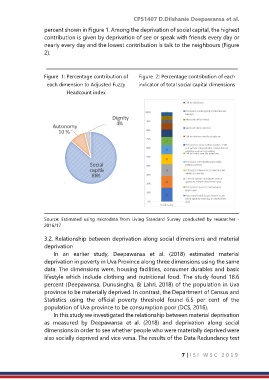
percent shown in Figure 1. Among the deprivation of social capital, the highest
contribution is given by deprivation of see or speak with friends every day or
nearly every day and the lowest contribution is talk to the neighbours (Figure
2).
Figure 1: Percentage contribution of Figure 2: Percentage contribution of each
each dimension to Adjusted Fuzzy indicator of total social capital dimensions
Headcount index
Dignity
4 %
Autonomy
10 %
Social
capita l
86 %
Source: Estimated using microdata from Living Standard Survey conducted by researcher -
2016/17
3.2. Relationship between deprivation along social dimensions and material
deprivation
In an earlier study, Deepawansa et al. (2018) estimated material
deprivation in poverty in Uva Province along three dimensions using the same
data. The dimensions were, housing facilities, consumer durables and basic
lifestyle which include clothing and nutritional food. The study found 18.6
percent (Deepawansa, Dunusingha, & Lahri, 2018) of the population in Uva
province to be materially deprived. In contrast, the Department of Census and
Statistics using the official poverty threshold found 6.5 per cent of the
population of Uva province to be consumption poor (DCS, 2016).
In this study we investigated the relationship between material deprivation
as measured by Deepawansa et al. (2018) and deprivation along social
dimensions in order to see whether people who were materially deprived were
also socially deprived and vice versa. The results of the Data Redundancy test
7 | I S I W S C 2 0 1 9