
Page 190 - Contributed Paper Session (CPS) - Volume 2
P. 190
CPS1820 Shuichi S.
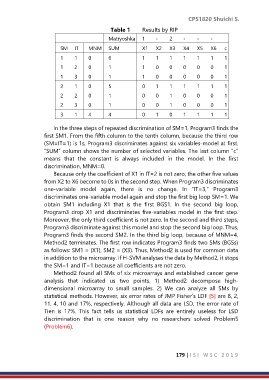
Table 1 Results by RIP
Matryoshka 1 - 2 - - -
SM IT MNM SUM X1 X2 X3 X4 X5 X6 c
1 1 0 6 1 1 1 1 1 1 1
1 2 0 1 1 0 0 0 0 0 1
1 3 0 1 1 0 0 0 0 0 1
2 1 0 5 0 1 1 1 1 1 1
2 2 0 1 0 0 1 0 0 0 1
2 3 0 1 0 0 1 0 0 0 1
3 1 4 4 0 1 0 1 1 1 1
In the three steps of repeated discrimination of SM=1, Program3 finds the
first SM1. From the fifth column to the tenth column, because the third row
(SM=IT=1) is 1s, Program3 discriminates against six variables-model at first.
“SUM” column shows the number of selected variables. The last column “c”
means that the constant is always included in the model. In the first
discrimination, MNM=0.
Because only the coefficient of X1 in IT=2 is not zero, the other five values
from X2 to X6 become to 0s in the second step. When Program3 discriminates
one-variable model again, there is no change. In “IT=3,” Program3
discriminates one-variable model again and stop the first big loop SM=1. We
obtain SM1 including X1 that is the first BGS1. In the second big loop,
Program3 drop X1 and discriminates five-variables model in the first step.
Moreover, the only third coefficient is not zero. In the second and third steps,
Program3 discriminate against this model and stop the second big loop. Thus,
Program3 finds the second SM2. In the third big loop, because of MNM=4,
Method2 terminates. The first row indicates Program3 finds two SMs (BGSs)
as follows: SM1 = (X1), SM2 = (X3). Thus, Method2 is used for common data
in addition to the microarray. If H-SVM analyses the data by Method2, it stops
the SM=1 and IT=1 because all coefficients are not zero.
Method2 found all SMs of six microarrays and established cancer gene
analysis that indicated us two points. 1) Method2 decompose high-
dimensional microarray to small samples. 2) We can analyze all SMs by
statistical methods. However, six error rates of JMP Fisher’s LDF [5] are 8, 2,
11, 4, 10 and 17%, respectively. Although all data are LSD, the error rate of
Tien is 17%. This fact tells us statistical LDFs are entirely useless for LSD
discrimination that is one reason why no researchers solved Problem5
(Problem6).
179 | I S I W S C 2 0 1 9