
Page 192 - Contributed Paper Session (CPS) - Volume 2
P. 192
CPS1820 Shuichi S.
Table 2 shows that the 64 discriminations by RIP are very easy. However,
statistical methods are difficult to obtain the linear separable fact (Problem6).
This fact implies the difficulties of cancer gene analysis until now and answer
why researchers could not succeed cancer gene analysis from 1970 because
these methods are useless for microarrays and those SMs. We must choose
proper methods for cancer gene diagnosis as same as cancer gene analysis.
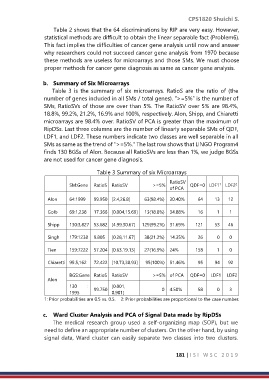
b. Summary of Six Microarrays
Table 3 is the summary of six microarrays. RatioS are the ratio of (the
number of genes included in all SMs / total genes). ">=5%" is the number of
SMs, RatioSVs of those are over than 5%. The RatioSV over 5% are 98.4%,
18.8%, 99.2%, 21.2%, 16.9% and 100%, respectively. Alon, Shipp, and Chiaretti
microarrays are 98.4% over. RatioSV of PCA is greater than the maximum of
RipDSs. Last three columns are the number of linearly separable SMs of QDF,
LDF1, and LDF2. These numbers indicate two classes are well separable in all
SMs as same as the trend of ">=5%." The last row shows that LINGO Program4
finds 130 BGSs of Alon. Because all RatioSVs are less than 1%, we judge BGSs
are not used for cancer gene diagnosis.
Table 3 Summary of six Microarrays
RatioSV
SM:Gene RatioS RatioSV >=5% QDF=0 LDF1 LDF2
1
2
of PCA
Alon 64:1999 99.950 [2.4,26.8] 63(98.4%) 30.40% 64 13 12
Golb 69:1,238 17.366 [0.004,15.69] 13(18.8%) 34.88% 16 1 1
Shipp 130:3,827 53.682 [4.99,30.67] 129(99.2%) 31.69% 121 53 46
Singh 179:1238 9.805 [0.28,11.67] 38(21.2%) 14.35% 26 0 0
Tien 159:7222 57.204 [0.63,19.13] 27(16.9%) 24% 158 1 0
Chiaretti 95:5,162 72.422 [10.73,38.93] 95(100%) 51.46% 95 94 92
BGS:Gene RatioS RatioSV >=5% of PCA QDF=0 LDF1 LDF2
Alon
130 : 99.750 [0.001, 0 4.50% 58 0 3
1995 0.901]
1: Prior probabilities are 0.5 vs. 0.5. 2: Prior probabilities are proportional to the case number.
c. Ward Cluster Analysis and PCA of Signal Data made by RipDSs
The medical research group used a self-organizing map (SOP), but we
need to define an appropriate number of clusters. On the other hand, by using
signal data, Ward cluster can easily separate two classes into two clusters.
181 | I S I W S C 2 0 1 9