
Page 193 - Contributed Paper Session (CPS) - Volume 2
P. 193
CPS1820 Shuichi S.
Furthermore, when we request for three or more clusters, the cancer class is
often divided into two or more clusters. If we attach the color to these clusters,
the scatter plot of PCA shows color segmented groups. We can easily find
subclass of cancer pointed out by Golub et al.
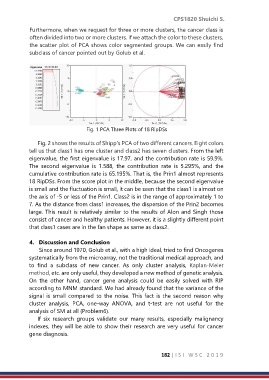
Fig. 1 PCA Three Plots of 18 RipDSs
Fig. 2 shows the results of Shipp's PCA of two different cancers. Eight colors
tell us that class1 has one cluster and class2 has seven clusters. From the left
eigenvalue, the first eigenvalue is 17.97, and the contribution rate is 59.9%.
The second eigenvalue is 1.588, the contribution rate is 5.295%, and the
cumulative contribution rate is 65.195%. That is, the Prin1 almost represents
18 RipDSs. From the score plot in the middle, because the second eigenvalue
is small and the fluctuation is small, it can be seen that the class1 is almost on
the axis of -5 or less of the Prin1. Class2 is in the range of approximately 1 to
7. As the distance from class1 increases, the dispersion of the Prin2 becomes
large. This result is relatively similar to the results of Alon and Singh those
consist of cancer and healthy patients. However, it is a slightly different point
that class1 cases are in the fan shape as same as class2.
4. Discussion and Conclusion
Since around 1970, Golub et al., with a high ideal, tried to find Oncogenes
systematically from the microarray, not the traditional medical approach, and
to find a subclass of new cancer. As only cluster analysis, Kaplan-Meier
method, etc. are only useful, they developed a new method of genetic analysis.
On the other hand, cancer gene analysis could be easily solved with RIP
according to MNM standard. We had already found that the variance of the
signal is small compared to the noise. This fact is the second reason why
cluster analysis, PCA, one-way ANOVA, and t-test are not useful for the
analysis of SM at all (Problem6).
If six research groups validate our many results, especially malignancy
indexes, they will be able to show their research are very useful for cancer
gene diagnosis.
182 | I S I W S C 2 0 1 9