
Page 254 - Contributed Paper Session (CPS) - Volume 2
P. 254
CPS1849 Shaymaa Wael A.R.
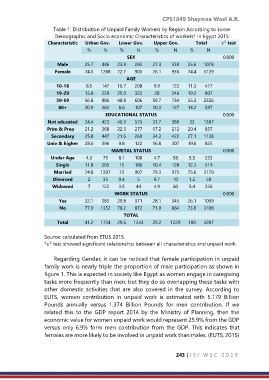
Table 1: Distribution of Unpaid Family Workers by Region According to some
Demographic and Socio economic Characteristics of workers* in Egypt 2015
Characteristic Urban Gov. Lower Gov. Upper Gov. Total test
2
% N % N % N % N
SEX 0.000
Male 25.7 446 23.9 293 27.3 339 25.6 1078
Female 74.3 1288 72.7 905 76.1 936 74.4 3129
AGE
10-18 8.5 147 16.7 208 9.9 122 11.3 477
19-29 13.8 239 25.9 322 20 246 19.2 807
30-59 56.8 986 48.8 606 59.7 734 55.3 2326
60+ 20.9 363 8.6 107 10.3 127 14.2 597
EDUCATIONAL STATUS 0.000
Not educated 24.4 423 46.3 575 31.7 389 33 1387
Prim & Prep 21.2 368 22.3 277 17.2 212 20.4 857
Secondary 25.8 447 21.6 269 34.3 422 27.1 1138
Univ & higher 28.6 396 9.8 122 16.8 207 19.6 825
MARITAL STATUS 0.000
Under Age 4.3 75 8.1 100 4.7 58 5.5 233
Single 11.8 205 15 186 10.4 128 12.3 519
Married 74.8 1297 73 907 79.3 975 75.6 3179
Divorced 2 35 0.4 5 0.7 10 1.2 50
Widowed 7 122 3.5 44 4.9 60 5.4 226
WORK STATUS 0.000
Yes 22.1 383 29.8 371 28.1 345 26.1 1099
No 77.9 1352 70.2 872 71.9 884 73.9 3108
TOTAL
Total 41.2 1734 29.6 1243 29.2 1229 100 4207
Source: calculated from ETUS 2015.
* test showed significant relationship between all characteristics and unpaid work
2
Regarding Gender, it can be noticed that female participation in unpaid
family work is nearly triple the proportion of male participation as shown in
figure 1. This is expected in society like Egypt as women engage in caregiving
tasks more frequently than men, but they do so overlapping these tasks with
other domestic activities that are also covered in the survey. According to
EUTS, women contribution in unpaid work is estimated with 5.179 Billion
Pounds annually versus 1.374 Billion Pounds for men contribution. If we
related this to the GDP report 2014 by the Ministry of Planning, then the
economic value for women unpaid work would represent 25.9% from the GDP
versus only 6.9% form men contribution from the GDP. This indicates that
females are more likely to be involved in unpaid work than males. (EUTS, 2015)
243 | I S I W S C 2 0 1 9