
Page 325 - Contributed Paper Session (CPS) - Volume 2
P. 325
CPS1874 Yiyao Chen et al.
3. Results
To illustrate the methodology we consider a risk model for prostate cancer
that would use as training and test sets, the 18727 participants from the PLCO
Trial and 26408 participants of SELECT, respectively. The prediction model
would be implemented with logistic regression using the covariates prostate-
specific antigen (PSA), race, age, family history, prior biopsy and prior benign
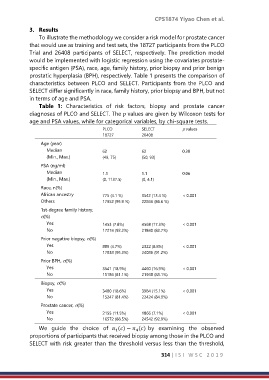
prostatic hyperplasia (BPH), respectively. Table 1 presents the comparison of
characteristics between PLCO and SELECT. Participants from the PLCO and
SELECT differ significantly in race, family history, prior biopsy and BPH, but not
in terms of age and PSA.
Table 1: Characteristics of risk factors, biopsy and prostate cancer
diagnoses of PLCO and SELECT. The values are given by Wilcoxon tests for
age and PSA values, while for categorical variables, by chi-square tests.
PLCO SELECT p values
18727 26408
Age (year)
Median 62 62 0.30
(Min., Max.) (49, 75) (50, 93)
PSA (ng/ml)
Median 1.1 1.1 0.06
(Min., Max.) (0, 1137.5) (0, 4.1)
Race, n(%)
African ancestry 775 (4.1 %) 3542 (13.4 %) < 0.001
Others 17952 (95.9 %) 22866 (86.6 %)
1st-degree family history,
n(%)
Yes 1453 (7.8%) 4568 (17.3%) < 0.001
No 17274 (92.2%) 21840 (82.7%)
Prior negative biopsy, n(%)
Yes 889 (4.7%) 2322 (8.8%) < 0.001
No 17838 (95.3%) 24086 (91.2%)
Prior BPH, n(%)
Yes 3541 (18.9%) 4460 (16.9%) < 0.001
No 15186 (81.1%) 21948 (83.1%)
Biopsy, n(%)
Yes 3480 (18.6%) 3984 (15.1%) < 0.001
No 15247 (81.4%) 22424 (84.9%)
Prostate cancer, n(%)
Yes 2155 (11.5%) 1866 (7.1%) < 0.001
No 16572 (88.5%) 24542 (92.9%)
We guide the choice of () − () by examining the observed
1
4
proportions of participants that received biopsy among those in the PLCO and
SELECT with risk greater than the threshold versus less than the threshold,
314 | I S I W S C 2 0 1 9