
Page 326 - Contributed Paper Session (CPS) - Volume 2
P. 326
CPS1874 Yiyao Chen et al.
which is in Figure 1. We might expect similar behavior among the principal
stratum of always biopsied participants. We therefore illustrate the method for
() a piecewise function with constant value 0.15 for in [0, 0.4] and 0.88
1
for in (0.8, 1]. For in (0.4, 0.8], () is given by monotonic linear
1
interpolation with the corresponding biopsy proportions. Moreover, we set
() = () and () = (). The resulting and are
4
1
2
3
calculated on the 3984 biopsied participants from SELECT and showed in
Figure 2.
The observed AUC on the test set is 59.4% (95% confidence interval (CI):
57.7% - 61.2%). The with the ()′ set to the piecewise linear functions
is very similar, 58.6% (95% CI: 56.5% - 60.7%), potentially because non-
identifiable biopsy rule was chosen to be similar to that observed.
4. Discussion
External validation of a risk tool should measure the quality of the risk tool,
but is unfortunately confounded by differences between the test and the
training sets. We have therefore borrowed principles from causal inference to
separate a pristine measure of reproducibility from the provided test set. We
suggest reporting this measure in addition to the observed operating
characteristics on the complete test set for the full range of assumed biopsy
probabilities for the principal stratum of always biopsied patients.
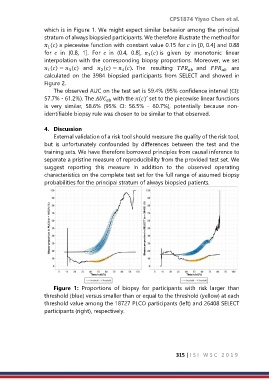
Figure 1: Proportions of biopsy for participants with risk larger than
threshold (blue) versus smaller than or equal to the threshold (yellow) at each
threshold value among the 18727 PLCO participants (left) and 26408 SELECT
participants (right), respectively.
315 | I S I W S C 2 0 1 9