
Page 327 - Contributed Paper Session (CPS) - Volume 2
P. 327
CPS1874 Yiyao Chen et al.
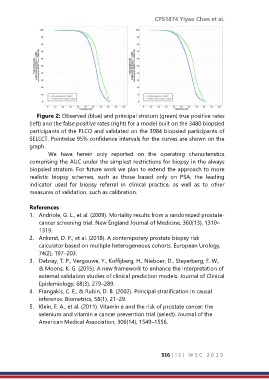
Figure 2: Observed (blue) and principal stratum (green) true positive rates
(left) and the false positive rates (right) for a model built on the 3480 biopsied
participants of the PLCO and validated on the 3984 biopsied participants of
SELECT. Pointwise 95% confidence intervals for the curves are shown on the
graph.
We have herein only reported on the operating characteristics
comprising the AUC under the simplest restrictions for biopsy in the always
biopsied stratum. For future work we plan to extend the approach to more
realistic biopsy schemes, such as those based only on PSA, the leading
indicator used for biopsy referral in clinical practice, as well as to other
measures of validation, such as calibration.
References
1. Andriole, G. L., et al. (2009). Mortality results from a randomized prostate-
cancer screening trial. New England Journal of Medicine, 360(13), 1310–
1319.
2. Ankerst, D. P., et al. (2018). A contemporary prostate biopsy risk
calculator based on multiple heterogeneous cohorts. European Urology,
74(2), 197–203.
3. Debray, T. P., Vergouwe, Y., Koffijberg, H., Nieboer, D., Steyerberg, E. W.,
& Moons, K. G. (2015). A new framework to enhance the interpretation of
external validation studies of clinical prediction models. Journal of Clinical
Epidemiology, 68(3), 279–289.
4. Frangakis, C. E., & Rubin, D. B. (2002). Principal stratification in causal
inference. Biometrics, 58(1), 21–29.
5. Klein, E. A., et al. (2011). Vitamin e and the risk of prostate cancer: the
selenium and vitamin e cancer prevention trial (select). Journal of the
American Medical Association, 306(14), 1549–1556.
316 | I S I W S C 2 0 1 9