
Page 371 - Contributed Paper Session (CPS) - Volume 2
P. 371
CPS1888 Chen C. et al.
quarterly change in inventories and a significant proportion of inventory
levels.
• Model from annuals approach – estimates are obtained by statistical
models using the relationship between GST data and inventories in our
annual financial collection. This method is suitable for some smaller
industries where the inventory levels remain relatively consistent over
time.
• Sample survey approach – If the above methods are not fit for purpose, a
stratified random sample survey is required. The sample only collects
inventories data. This is applicable to larger industries where the managed
collection inventory contribution is low.
3. Application
a. Producing efficiencies in existing outputs
The new approach was successfully implemented in the existing retail
trade, manufacturing and wholesale trade outputs. GST sales data is used
wherever possible, supplemented by a managed collection of large and
complex businesses where we continue to collect sales, inventories, and
salaries and wages on a quarterly basis.
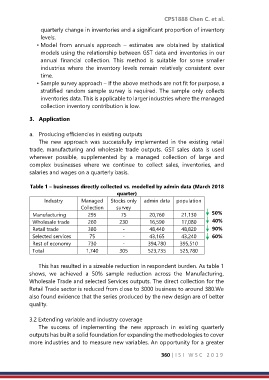
Table 1 – businesses directly collected vs. modelled by admin data (March 2018
quarter)
Industry Managed Stocks only admin data population
Collection survey
Manufacturing 295 75 20,760 21,130 50%
Wholesale trade 260 230 16,590 17,080 40%
Retail trade 380 - 48,440 48,820 90%
Selected services 75 - 43,165 43,240 60%
Rest of economy 730 - 394,780 395,510
Total 1,740 305 523,735 525,780
This has resulted in a sizeable reduction in respondent burden. As table 1
shows, we achieved a 50% sample reduction across the Manufacturing,
Wholesale Trade and selected Services outputs. The direct collection for the
Retail Trade sector is reduced from close to 3000 business to around 380.We
also found evidence that the series produced by the new design are of better
quality.
3.2 Extending variable and industry coverage
The success of implementing the new approach in existing quarterly
outputs has built a solid foundation for expanding the methodologies to cover
more industries and to measure new variables. An opportunity for a greater
360 | I S I W S C 2 0 1 9