
Page 105 - Contributed Paper Session (CPS) - Volume 4
P. 105
CPS2134 Yutaka Kuroki et al.
We could estimate the covariance matrix of the sample errors by
1 1
′
′
̂ = ∑ ̂ , ̂ = (̂ , … , ̂ ) , ( ̂) = ∑( ̂ − ̂) ( ̂ − ̂) ,
2
=1 =1
and then use sampling theory to test whether all the errors are jointly zero.
See Cochrane (2005).
2
′
−1
̂ ( ̂) ̂ ∼ −1 .
In the case of this study, the p-value of the above test statistic is 0.534 and it
shows the errors are not significantly different from zero.
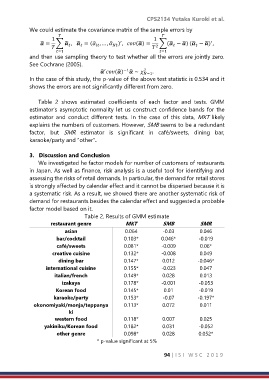
Table 2 shows estimated coefficients of each factor and tests. GMM
estimator’s asymptotic normality let us construct confidence bands for the
estimator and conduct different tests. In the case of this data, MKT likely
explains the numbers of customers. However, SMB seems to be a redundant
factor, but SMR estimator is significant in café/sweets, dining bar,
karaoke/party and “other”.
3. Discussion and Conclusion
We investigated he factor models for number of customers of restaurants
in Japan. As well as finance, risk analysis is a useful tool for identifying and
assessing the risks of retail demands. In particular, the demand for retail stores
is strongly affected by calendar effect and it cannot be dispersed because it is
a systematic risk. As a result, we showed there are another systematic risk of
demand for restaurants besides the calendar effect and suggested a probable
factor model based on it.
Table 2. Results of GMM estimate
restaurant genre MKT SMB SMR
asian 0.064 -0.03 0.046
bar/cocktail 0.103* 0.046* -0.019
café/sweets 0.081* -0.009 0.06*
creative cuisine 0.132* -0.008 0.049
dining bar 0.147* 0.012 -0.046*
international cuisine 0.155* -0.023 0.047
italian/french 0.149* 0.028 0.013
izakaya 0.178* -0.001 -0.053
Korean food 0.145* 0.01 -0.019
karaoke/party 0.153* -0.07 -0.197*
okonomiyaki/monja/teppanya 0.113* 0.072 0.011
ki
western food 0.118* 0.007 0.025
yakiniku/Korean food 0.182* 0.031 -0.052
other genre 0.098* 0.028 0.052*
* p-value significant at 5%
94 | I S I W S C 2 0 1 9